Download
1 / 11
120 likes | 236 Views
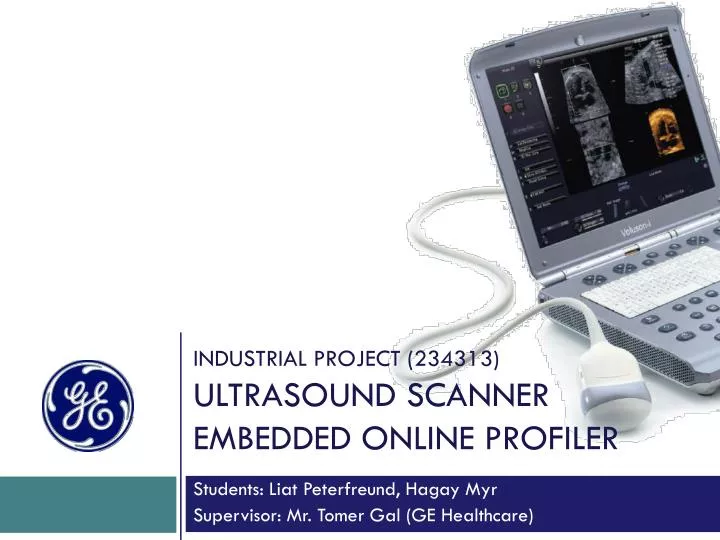
Industrial project (234313) ultrasound scanner embedded online profiler. Students: Liat Peterfreund , Hagay Myr Supervisor: Mr. Tomer Gal (GE Healthcare). Project Objectives.

E N D
Industrial project (234313)ultrasound scanner embedded online profiler Students: LiatPeterfreund, HagayMyr Supervisor: Mr. Tomer Gal (GE Healthcare)
Project Objectives • Implement a statistical profiler for an Ultrasound-System (ULS) software that its results will be used for debugging and optimizations. • The target platforms are already deployed systems, means – not in a debug-able environment. • The profiler should have minimum impact on the examined process and should work efficiently and quickly.
Methodology • Sampling (halting) the process every pre-defined time interval • Collecting call-stacks frames of all the process’ threads in every sample • Analyzing the information – resolving the collected frames into their symbols and providing the actual Profiling information.
Profiler Overview (1) • The user sets-up the profiling session: • Profiled process • Running process – by its PID or its exact name • New process – by the full path of an executable • Profiling session duration • Profiling session start delay • Time interval between samples • Stack depth to be examined • Minimal thread runtime (threshold) – below it the thread won’t be examined • The profiler is then activated and starts to collect the Call-Stacks of all the process’ threads. • After collecting the samples, the profiler analyzes the information • Resolves the symbols of all the gathered stack-frames • Calculates the profiling info for each symbol • Relative part of his net runtime (without his sons) out of the total activation time • Relative part of his sons’ total runtime out of the total activation time
Profiler Overview (2) • The profiling mechanism is built of three threads : • Main thread – the thread which sets-up, controls and analyzes the profiling session • Breaker thread – sends the analyzed process an Exception-Debug-Event of type Breakpoint in a pre-defined frequency • Listener thread – listens for Debug-Events from the analyzed process and reacts accordingly to fulfill the following: • Maintain the process’ active threads list (Create-Thread and Exit-Thread events) • Collect the call-stacks frames of the active threads (Breakpoint-Exception events)
Achievements since Midterm (1) • Optimized performance • Internal console prints at a later time • Threshold of minimum activeness of a thread • Threads that haven’t been active at all between two consecutive samples are ignored • Improved analysis • Symbols resolving with cache (for future extensions) • The entire stack as the key for analysis • Portable implementation • DLL, LIB and H files to be used by any application
Achievements since Midterm (2) • UI support • There is a well defined protocol between UI and the profiler • The client applications inherits the provided ProfilerClient interface. • The client application registers itself with the profiler • The client gets an event from the profiler when there is a incoming message. • Our GUI uses polling instead of the above mechanism due to compatibility problem between managed and unmanaged syntax
Achievements All-Together • Fully functional, optimized and deployable Profiler • Can be integrated into any developed software • Shared library (DLL) to be linked with the developed application • Can be used as an independent analysis tool • Console tool • GUI tool (an extra capability) • Windows Form Application • Provides a full setup and control interface • Views the statistics in a convenient tree-like grid • Can be used both in the factory and on the field to analyze, debug and improve the ULS system’s software • Presumably will be deployed with future releases of the ULS software
Demonstration • Lets profile stuff…
Conclusions • The course exposed us to GE Healthcare company • We were given a tour in the GE Healthcare factory, were introduced with both the engineers and the products, from legacy to most recent ultrasound systems • The course exposed us to new technologies and environments • Windows API and Windows Debugging API • Windows Form Application • The course improved our skills as software engineers • Improved design and coding skills • Keep to schedule – deliver what was expected and on time • Teamwork – parallelization of the development
The End Thanks!