Download
1 / 1
10 likes | 175 Views
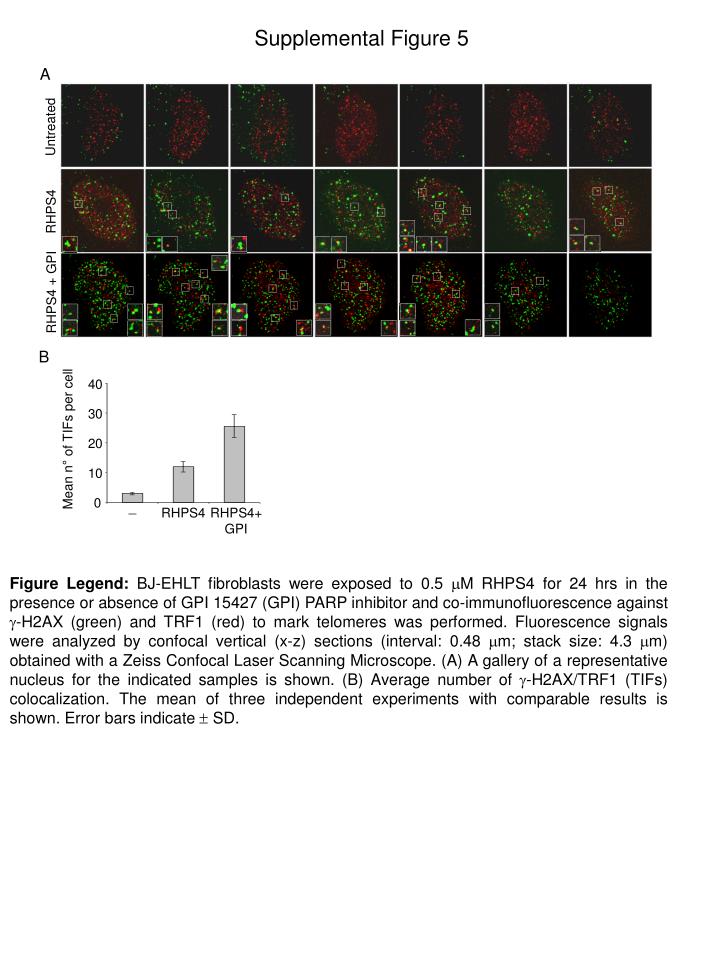
Supplemental Figure 5. A. Untreated. RHPS4. RHPS4 + GPI. B. 40. 30. Mean n° of TIFs per cell. 20. 10. 0. _. RHPS4. RHPS4+ GPI.

E N D
Supplemental Figure 5 A Untreated RHPS4 RHPS4 + GPI B 40 30 Mean n° of TIFs per cell 20 10 0 _ RHPS4 RHPS4+ GPI Figure Legend: BJ-EHLT fibroblasts were exposed to 0.5 M RHPS4 for 24 hrs in the presence or absence of GPI 15427 (GPI) PARP inhibitor and co-immunofluorescence against -H2AX (green) and TRF1 (red) to mark telomeres was performed. Fluorescence signals were analyzed by confocal vertical (x-z) sections (interval: 0.48 m; stack size: 4.3 m) obtained with a Zeiss Confocal Laser Scanning Microscope. (A) A gallery of a representative nucleus for the indicated samples is shown. (B) Average number of -H2AX/TRF1 (TIFs) colocalization. The mean of three independent experiments with comparable results is shown. Error bars indicate SD.