Download
1 / 88
880 likes | 993 Views
Low and intermediate mass dimuons in NA60. G. Usai – INFN and University of Cagliari (Italy). General question of QCD. Origin of the masses of light hadrons?. spontaneous chiral symmetry breaking <qq> ≠ 0.

E N D
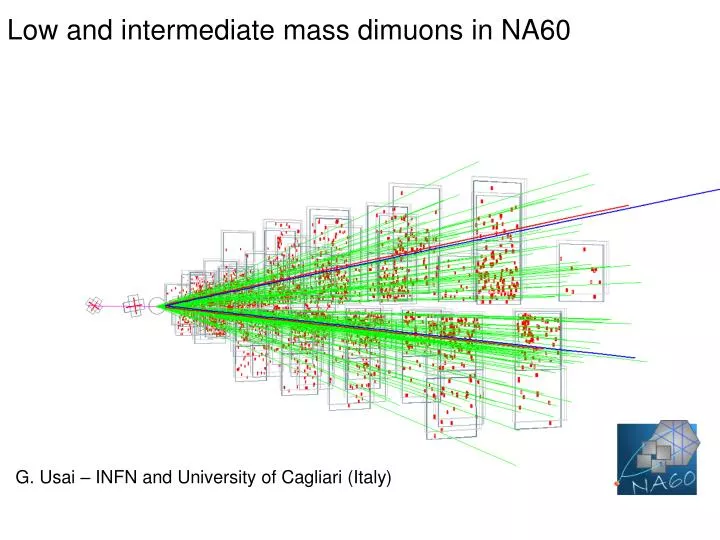
Low and intermediate mass dimuons in NA60 G. Usai – INFN and University of Cagliari (Italy)
General question of QCD Origin of the masses of light hadrons? spontaneous chiral symmetry breaking <qq> ≠ 0 Expectation: approximate chiral SU(nf)L x SU(nf)R symmetry chiral doublets, degenerate in mass, with However, we observe
Several theoretical approaches including lattice QCD still in development Lattice QCD(for mB=0 andquenched approx.) two phase transitions at the same critical temperature Tc cL - cm ‹qq› L 1.0 T/Tc 1.0 T/Tc deconfinement chiral symmetry transition restoration hadron spectral functions on the lattice only now under study explicit connection between spectral properties of hadrons (masses,widths) and the value of the chiral condensate <qq> ? Use r as a probe for the restoration of chiral symmetry (Pisarski, 1982)
Why focus (mainly) on the r? Gtot [MeV] r (770)150 (1.3fm/c) w(782) 8.6 (23fm/c) f(1020) 4.4 (44fm/c) In-medium radiation dominated by the : • r life time t=1.3 fm/c << tcollision> 10 fm/c • continuous “regeneration” by main difficulty: Properties of r in hot and dense matter unknown (related to the mechanism of mass generation) Properties of hot and dense medium unknow (general goal of studying nuclear collisions)
muon trigger and tracking target beam hadron absorber Muon Other Standard dimuon detection: NA50, PHENIX, ALICE, … magnetic field Thick hadron absorber to reject hadronic background Trigger system based on fast detectors to select muon candidates (1 in 10-4 PbPb collisions at SPS energy) Muon tracks reconstructed by a spectrometer (tracking detectors+magnetic field) Extrapolate muon tracks back to the target taking into account multiple scattering and energy loss, but … -poor reconstruction of interaction vertex (sz 10 cm) - poor mass resolution (80 MeV at the f)
muon trigger and tracking magnetic field or hadron absorber ! Muon Other Measuring dimuons in heavy ion collisions – the NA60 case 2.5 T dipole magnet beam tracker vertex tracker targets Matching of muon tracks • Origin of muons can be accurately determined • Improved dimuon mass resolution
The NA60 pixel vertex detector DIPOLE MAGNET 2.5 T HADRON ABSORBER TARGETS ~40 cm • 12 tracking points with good acceptance 8 “small” 4-chip planes, plus 8 “big” 8-chip planes (4 tracking stations) • ~ 3% X0 per plane 750 µm Si read-out chip 300 µm Si sensor ceramic hybrid • 800’000 R/O channels - 96 pixel assemblies 1 cm
Beam Trackersensors windows Vertexing Y X Resolution ~ 10 - 20 min thetransverse plane z~ 200 malong thebeamdirection Good vertex identification with 4 tracks Extremely cleantarget identification (Log scale!)
Contributions to dimuon mass resolution The dimuon invariant mass resolution has two components Multiple scattering in the hadron absorber dominates the resolution for low momentum muons The variance ϑs of the angle distribution is proportional to 1/p At high momenta the resolution is dominated by the tracking accuracy (dp/p proportional to p) at mmm~ 3 GeV the resolution is dominated by this component Track matching not so important at mmm ~ 1 GeV track matching is very effective to increase the momentum resolution
Muon track matching The muon spectrometer and the pixel telescope determine the track parameters in two reference planes z1 and z2. A choice of the track parameters at each plane is Muon spectrometer Absorber Pixel telescope Measured points Measured points p1,r and its covariance matrix are propagated to z2
muon spectrometer track parameters with errors muon spectrometer surface z1 Contributions to multiple scattering between z1 and z2 are added to C’1 hadron absorber muon spectrometer track parameters propagated to pixel telescope surface pixel telescope track parameters with errors pixel telescope surface z2 weigthed mean joint least square ansatz M(p2,fit) distributed as a c2 with 5 dof
M(p2,fit) distributed as a c2 with 5 degrees of freedom The pixel telescope improves drastically the angular resolution: ~10 mrad (muon spectrometer only) ~1 mrad (adding pixel telescope) The momentum resolution is comparable in the two detectors. However, the use of the momentum information in a high multiplicity environment is fundamental to achieve the matching the pixel telescope must be a spectrometer
Improvement in mass resolution • Opposite-sign dimuon mass distributions before quality cuts • No muon track matching • (two magnet settings) 4000 A (1020) f(1020) sM(f) 20 MeV sM(f) 80 MeV dN/dMmm (Events/50 MeV) sM(J/) 100 MeV sM(J/) 70 MeV Vertex selection and muon track matching Drastic improvement in mass resolution: Narrow vector mesons clearly resolved But still sitting on a large unphysical background (80% of collected statistics) 4000 A (100% of collected statistics) 6500 A
Muon spectrometer muon trigger and tracking fake target Hadron absorber correct hadron absorber Problems with the matching: fake matches Fake match: muon matched to a wrong track in the vertex telescope Can be important in high multiplicity events (negligible in pA or peripheral AA) Simple technique: the match with the smallest c2 is retained. But is it correct or fake? Fake matches can be studied and subtracted using an overlay Monte Carlo: - Monte Carlo muons are superimposed to real events (in the vertex telescope) - Reconstructed as real events, fake matches can be tagged and the fraction relative ....to correct matched muons is then evaluated
The Monte Carlo provides also the kinematic distribution (mass, pT, ...) of the fake matches Here is the example for the f meson The fake-match contribution appears localized in mass (and pT) space as a broad peak correct matches:s= 23 MeV wrong matches: fake = 110 MeV
Background sources (dimuons) Main source of background: (uncorrelated) decays of p and K the hadron absorber should be as close as possible to the interaction point If we have N pions, the average number which decays within 1m is m~10-3N We have the probabilities ( ) number of detected muon pairs is A++ (A--) acceptance for a like sign muon pair A+- acceptance for a opposite sign muon pair
In NA50 acceptance was independent of charge In NA60 acceptance is different for + and – Cuts to equalize it (“image” cut in NA50) impossible Event Mixing: Define a pool of m+ and m- tracks out of a sample of like sign events (++ and --) . Pick m+ and m- from these like sign pools corresponding to different events. The m+ and m- are picked in a fraction which reflects the probabilities to detect them in the experimental apparatus Combine them to form artificial pairs of all sign combinations. If N++(mixed) and N--(mixed) reproduce the corresponding data samples N++ and N--, then N+-(mixed) shouldgive the combinatiorial background of the +- sample.
Accuracy of background subtraction Estimated estimated through the comparison of N++/--(mixed) to N++/--(real) In NA60 the accuracy is ~1% all over the dimuon mass range. Is that good or bad? It depends on the signal to background ratio ...
The signal to background ratio depends on the matching c2 cut. Tight cut: more precise matching – helps to reject tracks not precisely connected to primary vertex 1% • The worst case happens in the continuum region around the w, where the bkg/signal can reach ~25 in the most central collisions • ssignal/signal ~ 25% in low mass continuum region at most In more peripheral collisions ssignal/signal is much better
The quest of the correct background normalization CLAS experiment: photoproduction of vector mesons off nuclei e+e- combinatorial background determined by event mixing Background normalization found directly from fit: best fit prefers r meson withmass shift (in medium effect) Background normalization following prescription for P+ P-: best fit prefers r meson withno in medium effect
The final mass spectra (mmm<2GeV/c2) Red distribution: final spectrum after getting rid of fake and combinatorial background. The net data sample consists of 420000 events! ( 50% of total statistics) f For the first time and peaks are clearly visible in dilepton channel (23 MeV/c2 mass resolution at the f) is also visible • Fakes/CB < 10 %
Phase phase coverage (mass-pT) without field A A (%) (%) with 2.5 T field 0.20<M<0.45 NA60 0.45<M<0.70 Monte-Carlo NA38 0.45<M<0.70 The dimuon kinematics can be specified by (m,y,pT,cosϑ) The probability that a dimuon with certain kinematic values is detected depends on: Thickness of the muon filter, position of the target relative to the detecting elements, magnetic fields (both in the muon spectrometer and in the vertex telescope), ... Drop with no vertex magnet The dipole magnetic field in the vertex region improves significantly the acceptance for low mass and low pTopposite sign dimuons
Phase phase coverage (y-pT) A fixed target experiment usually covers the forward rapidity emisphere. NA60 (and its predecessors) are optimized to cover the range 3-4 in the lab system (the target rapidity is zero, the beam rapidity is 6) corresponding to 0-1 in the CMS system Example of phase space coverage for a few processes (Monte Carlo) mmg rmm fmm • Dimuon rapidity coverage in the lab frame: • roughly between 3.3 and 4.3 for low masses • between 3 and 4 for the J/y dimuons • (mid rapidity is at 2.9)
Measuring the collision centrality The collision centrality can be measured via the charged particle multiplicity as measured by the pixel vertex telescope Track multiplicity of charged tracks for triggered dimuons for opposite-sign pairs combinatorial backgroundsignal pairs 4 multiplicity windows:
Which processes populate the dimuon mass spectrum below 1 GeV?
Vector meson dominance: p0(k) p0(k) r(q2) m+ p1 m+ p1 g*(q2) g*(q2) m-p2 m-p2 m+m- Anomaly in the form-factor: VMD predicts a (significantly) smaller value Dalitz decay: m+m-p0
p0(k) ,r(q2) p0(k) m+ p1 g*(q2) m+ p1 m-p2 g*(q2) m-p2 Vector meson dominance Previous data (Landsberg et al.) fitted with a pole formula: m+m- Dalitz decay: m+m-g Dalitz form factor
Isolate possible excess by subtracting cocktail (without r) from the data How to fit in the presence of an unknown source? Try to findexcess above cocktail(if it exists) without fit constraints • ωand : fix yields such as to get, after subtraction, a smoothunderlying continuum • : ()set upper limit, defined by “saturating” the measured yield in the mass region close to 0.2 GeV (lower limit for excess). () use yield measured for pT > 1.4 GeV/c
Evolution of the excess shape with centrality • No cocktail rand noDDsubtracted The evolution of the excess with centrality can be studied with precision with a rather fine binning in multiplicity data – cocktail (all pT) • Clear excessabove the cocktail ,centered at the nominal r poleand rising with centrality • Excess even more pronounced at low pT cocktail / =1.2
Sensitivity of the difference procedure Change yields of , and by +10%: enormous sensitivity, on the level of 1-2%, to mistakes in the particle yields. The difference spectrum is robust to mistakes even on the 10% level, since the consequences of such mistakes are highly localized.
Systematics The largest source of systematic error comes from the subtraction of combinatorial and fake matches background. In principle there are other uncertainty sources as the form factors, but these are negligible compared to the background. Illustration of sensitivity to correct subtraction of combinatorial background and fake matches;to variation of the yield The systematic errors of continuum 0.4<M<0.6 and 0.8<M<1GeV are 25% (at most) in the most central collisions The structure in region looks rather robust
Evolution of the excess shape as a function of centrality Quantify the peak and the broad symmetric continuum with a mass interval C around the peak (0.64 <M<0.84 GeV) and two equal side bins L, U continuum = 3/2(L+U) peak = C-1/2(L+U) Fine analysis in 12 centrality bins continuum/r Peak/cocktail r drops by a factor 2 from peripheral to central: the peak seen is not the cocktail r peak/r nontrivial changes of all three variables at dNch/dy>100 ? peak/continuum
p-r, and electromagnetic interactions in vacuum Free r Lagrangian (vector meson) Free pions Lagrangian self interactions are neglected p-r and e.m. interactions introduced via gauge couplings g = grp = pion-r coupling constant Direct g-r coupling The r couples only to conserved currents, so that
g r g g g VMD If g = grg electromagnetic field equations The r meson is the only hadronic source of the electromagnetic field The hadronic part of the electromagnetic current is then proportional to the r meson field What does it mean? Hadron matter couples to a qqbar pair which propagates as a vector meson which then materializes as a photon All QCD complexity, gluon self interactions and confinement are incorporated in the physical vector meson which forms the intermediate state m+ m- Hadron medium g r r
The r self-energy r r r p p r r r r = + 1PI The free rm field describes a “bare” meson which we can interpret as the qqbar component of the physical r meson. The bare r propagator is given by However, r is strong coupled to pions the physical r meson appears as a broad resonance. properties accounted for by the second order self-energy diagrams
Ther dressed propagator Without loss of generality where r “polarization scalar” The full (dressed) propagator comes from an infinite sum of diagrams with self-energy insertions 1PI 1PI 1PI This infinite series can be easily summed ... The r field is always coupled to conserved currents (qmJm = 0) and so the terms proportional to qmqn can be dropped
The imaginary part of Pr r r scattering rr = 1PI According to the optical theorem general expression of the decay width In this specific case the final state is (dominantly) pp. Thus we come to the result mass dependent width
♦ Frogatt and Petersen I=1 P wave pp phase shift d1 [degrees] The real part of Pr Determines the mass shift due to the self-energy: Needed to keep the photon massless Regularization. Cut-off or dispersion relations Fixes c1 m0r can be fixed from the comparison to the measured p+p- p+p- elastic cross section The mass shift induced by the rpp self-energy is small
p p r is dressed with free pions vacuum spectral function (like ALEPH data V(t→ 2pnt ))
g*(q) μ+ μ- (T,mB) Dilepton Rate in a strongly interacting medium dileptons produced by annihilation of thermally excited particles: +- in hadronic phase qq in QGP phase at SPS energies + -→*→μ+μ- dominant hadron basis photon selfenergy spectral function Vector-Dominance Model
Physics objective in heavy ion collisions Study the properties of ther spectral function Im Drin a hot and dense medium
r spectral function in hot and dense hadronic matter rB /r0 0 0.1 0.7 2.6 Hadronic many-body approachRapp/Wambach et al., Weise et al. hot matter hot and baryon-rich matter is dressed with: hot pions Prpp ,baryonsPr B(N,D ..) mesonsPr M (K,a1..) • “melts” in hot and dense matter • - pole position roughly unchanged - broadening mostly through baryon interactions
r spectral function in hot and dense hadronic matter Dropping mass scenarioBrown/Rho et al., Hatsuda/Lee explicit connection between hadron masses and chiral condensate universal scaling law continuous evolution of pole mass with T and r ; broadening atfixed T,r ignored
Final mass spectrum rB /r0 0 0.1 0.7 2.6 continuous emission of thermal radiation during life time of expanding fireball integration of rate equation over space-time and momenta required example: broadening scenario
Thus, the spectral function accessible through rate equation, integrated over space-time and momenta Limitation:Continuously varying values of temperature T and baryon density rB,
Comparison of predictions to data Two possibilities, in principle: 1) Use the prediction for Generate Monte Carlo events of g* decays into muon pairs Propagate through the acceptance filter and compare to uncorrected data Done presently for invariant mass (work in progress for acceptance correction) 2) Correct the data for acceptance in 3-dim space M-pT-y and compare them directly to predictions Done for pT distributions
Acceptance filtering of theoretical prediction in NA60 rB /r0 0 0.1 0.7 2.6 Input (example): thermal radiation based on RW spectral function all pT Output:spectral shape much distorted relative to input, but somehow reminiscent of thespectral functionunderlying the input; by chance?
Comparison to the main models that appeared in the 90s Rapp-Wambach: hadronic model predicting strong broadening/no mass shift Brown/Rho scaling: dropping mass due to dropping of chiral condensate Predictions for In-In by Rapp et al (2003) for dNch/d = 140, covering all scenarios Theoretical yields normalized to data in mass interval < 0.9 GeV After acceptance filtering,data and predictions displayspectral functions, averaged over space-time and momenta Only broadening of (RW) observed, no mass shift (BR)
Comparison to the main models that appeared in the 90s • Without baryons: • Not enough broadening • Lack of strength below the r peak • Improved model: • Fireball dynamics • 4 p processes • spectrum described in absolute terms
Semicentral collisions: low vs high pT Rapp-Hees Rapp-Hees Something is missing at high pT. What?