Download
1 / 35
420 likes | 657 Views
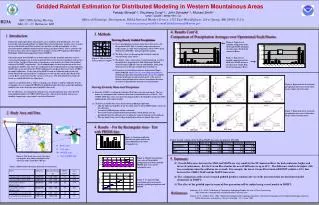
Poverty Estimation in Small Areas. Agne Bikauskaite. European Conference on Quality in Official Statistics (Q2014) Vienna, 3-5 June 2014. Data:. The population size N = 3000 The s ample size n = 300 Number of mutually exclusive strata H = 7

E N D
Poverty Estimation in Small Areas Agne Bikauskaite European Conference on Quality in Official Statistics (Q2014) Vienna, 3-5 June 2014
Data: • The population sizeN = 3000 • The sample size n = 300 • Number of mutually exclusive strata H = 7 • The income of individuals (yh1, ..., yhN) • The auxiliary information (x1i, ..., xji, ..., xJi) • 1000 simple random samples
Data: • The population sizeN = 3000 • The sample size n = 300 • Number of mutually exclusive strata H = 7 • The income of individuals (yh1, ..., yhN) • The auxiliary information (x1i, ..., xji, ..., xJi) • 1000 simple random samples
Stratified Sampling • The sample design probability when element i belongs to stratum h is • The sampling weight for selected person i from the h stratum is
Estimated parameters • The Average Income • The Poverty Line • The Headcount Index • The Poverty Gap Index
The Average Income • The average income in strata h is • The average income estimate is
The Poverty Line • The Poverty Line is defined as 60 per cent of the median equivalent disposable income • The Poverty Line estimate is
The Headcount Index • The headcount index is defined as the number of persons below the poverty line divided by the population number • The Headcount index estimate is
The Poverty Gap • The poverty gapG is defined as an amount of difference between poverty line and income value y of ith person living in poverty or social exclusion • The poverty gap estimate
The Poverty Gap Index • The poverty gap index is a proportion of the poverty gap and the poverty line • The poverty gap index estimate is
Direct and Indirect Estimates • Direct Estimates: • Not using auxiliary information • Using auxiliary information from the same area • Indirect Estimates: • Using auxiliary information from adjacent areas
Simulated Estimation Methods • The Horvitz-Thompson (HT) • The Generalised Regression (GREG) • The Synthetic (S)
The Absolute Relative Bias • The Absolute Relative Bias (ARB) assessed the accuracy of the estimates
The Horvitz-Thompson estimator • The sum estimate is
The GREG estimator • The sum estimate
The Synethetic estimator • The sum estimate is
The Jack-Knife method • The Jack-Knife method’s idea is to divide stratified sample into mutually exclusive subgroups. • The modified sampling weights
The Jack-Knife variance estimator • Then the Jack-Knife variance estimator of estimated parameter is
Conclusions:Poverty parameters estimation • Different estimation methods for large and for small areas • The Synthetic method for poverty estimation in small areas • If auxiliary information from adjacent areas is not available then the most appropriate estimation method is Horvitz-Thompson
Conclusions:Variances estimation of the estimated parameters • Large ARBs • The best results of estimation are given by the Horvitz-Thompson method • Applying Jack-Knife method precision of the estimates increases when the group size is extremely small