Download
1 / 10
100 likes | 123 Views
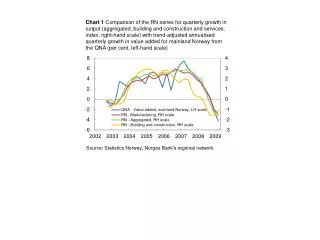
Explore the annual percentage growth of value added per hour worked, capital stock per hour worked, and correlations between value added and labor productivity in Mainland Norway from 1948 to 2008. Analyze key sectors like manufacturing, wholesale and retail trade, and other private services to understand productivity trends. Charts provided by Statistics Norway and Norges Bank. Compare Norway's productivity growth with EU15 countries and examine average annual percentage growth in value added per worker.

E N D
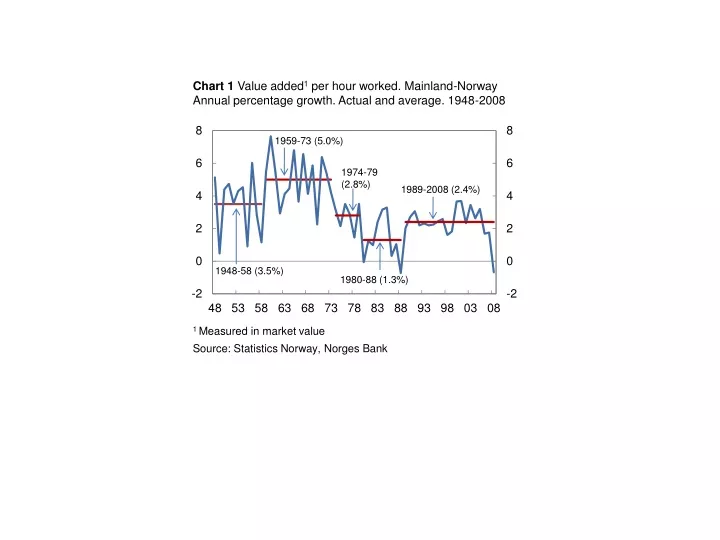
Chart 1 Value added1 per hour worked. Mainland-NorwayAnnual percentage growth. Actual and average. 1948-2008 1959-73 (5.0%) 1974-79(2.8%) 1989-2008 (2.4%) 1948-58 (3.5%) 1980-88 (1.3%) 1 Measured in market value Source: Statistics Norway, Norges Bank
Chart 2 Capital stock per hour worked. Mainland Norway. Index: 1947=100. 1947-2008 Source: Statistics Norway, Norges Bank
Chart 3 Correlation between value added and labour productivity.1 Ten-year rolling windows. 1955-2008 1 Correlation between the cyclical components of the series. The cyclical components are calculated using an HP filter with a smoothing parameter equal to 100 Source: Statistics Norway, Norges Bank
Chart 4 Productivity.1 Mainland Norway. Annual percentage growth. 1948-2008 1 Measured in market value Source: Statistics Norway, Norges Bank
Chart 5 Productivity growth. Manufacturing. Annual percentage growth. Actual and average. 1948-2008 1948-74 (4.5%) 1975-2008 (1.9%) Source: Statistics Norway, Norges Bank
Chart 6 Productivity growth. Wholesale and retail trade. Annual percentage growth. Actual and average. 1948-2008 1948-87 (2.8%) 1993-2008 (6.1%) 1988-92 (-1.5%) Source: Statistics Norway, Norges Bank
Chart 7 Productivity growth. Other private services.1Annual percentage growth. Actual and average. 1948-2008 1991-2008 (1.9%) 1948-90 (0.2%) 1 Financial and corporate services. Source: Statistics Norway, Norges Bank
Chart 8 Productivity growth. Five-year rolling average. Centred on last year. 1975-2008 1 EU15 excluding Greece, Luxembourg, Portugal and Austria Source: OECD, Statistics Norway, Norges Bank
Chart 9 Average annual percentage growth in value added per worker. 1999-2007 Source: OECD
Chart 10 Value added1 per hour worked. Mainland-NorwayAnnual percentage growth. Actual and average. 1948-2008 1948-73 (4.3%) 1974-2008 (2.1%) 1 Measured in market value Source: Statistics Norway, Norges Bank