Download
1 / 51
520 likes | 574 Views
Structure and properties of colloidal glasses. Dave Weitz Harvard. NSF, NASA. Peter Schall Amsterdam Frans Spaepen Harvard Al Fernandez Nieves Harvard Johan Mattsson Gothenburg Dave Reichmann Columbia . Jaci Conrad UIUC Eric Weeks Emory Hans Wyss Harvard Christoph Eisenman Munich

E N D
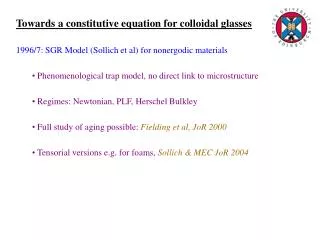
Structure and properties of colloidal glasses Dave Weitz Harvard NSF, NASA Peter Schall Amsterdam Frans Spaepen Harvard Al Fernandez Nieves Harvard Johan Mattsson Gothenburg Dave Reichmann Columbia Jaci Conrad UIUC Eric Weeks Emory Hans Wyss Harvard Christoph Eisenman Munich Param Dhillon Columbia Relaxation in supercooled colloidal glasses: Correlated motion ‘Force’ chains Shear zones Flow of colloidal glasses Microgel glasses analogy to molecular glasses http://www.seas.harvard.edu/projects/weitzlab UBC 7/21/07
Hard Sphere Glasses liquid - crystal coexistence liquid crystal 58% 49% 54% 63% 74% f “supercooled” glass fxtal0.54 fliquid0.48 Maximum packing fRCP0.63 Maximum packing fHCP=0.74
Confocal Microscopy rotating mirrors screen with pinhole laser detector (PMT) detector lens pinhole microscope objective in focus sample out of focus Regular Confocal
0.2 mm Confocal microscopy for 3D pictures Scan many slices, reconstruct 3D image
y(t) 0.5 mm time (s) Brownian Motion (2 mm particles, dilute sample)
10-1 10-2 Slope=1 10-3 10-4 10-5 -2 0 2 Dx (mm) Dt (s) Diffusion: dilute samples Mean square displacement: Displacement distribution function: Dx2 (mm2) P(Dx) Dt=0.5s Gaussian Particle size a Leads to normal diffusion: Dx2 = 2Dt viscosity
Voronoi polyhedra --Delaunay triangulation (“Wigner-Seitz cell”) defines nearest neighbor particles
Cage trapping: 3D x2 mm2 2D lag time Dt (s) Mean-squared displacementf=0.53 -- “supercooled fluid” f=0.56, 100 min (supercooled fluid) • Short times: particles stuck in “cages” • Long times: cages rearrange
1 micron Trajectories of “fast” particles, f=0.56 shading indicates depth
3D x2 mm2 2D lag time Dt (s) Displacement distribution function Dt = 1000 s f = 0.53: “supercooled fluid” Nongaussian Parameter
Structural Relaxations in a Supercooled Fluid Number of relaxing particles time Relaxing particles are highly correlated spatially
Structural Relaxations in a Glass Number of relaxing particles time Relaxing particles are NOT correlated spatially
Cluster size grows as glass transition is approached average cluster size volume fraction
What is a Glass? • Glass must have a low frequency shear modulus • Must have force chains to transmit stress
Identify Static Particles Topological Change: nn (t) t0 t0+t t0 t0+t nn = 1 nn = 2 B. Doliwa and A. Heuer, J. Non-Cryst. Solids 307, 32 (2002).
Dt Static Clusters Form Stress-Bearing Chains f = 0.52 f = 0.56 f = 0.60 Supercooled fluid Supercooled fluid Glass
Properties of Static Clusters Number of particles in cluster Mean square displacement Non-Gaussian parameter
Experiment and simulation agree Experiment Simulation
(micrometer screws) (piezo) bellow cover slip silicon wafer PMMA coating < 100 microns 5 mm Shear cell
z Dz y Shear profile
Glasses : Shear strain network Diffusion coefficient Shear energy
Effective diffusion coefficient depends on shear rate V ~ 4 particles
Glasses : Shear experiment metal grid
Glasses : Shear experiment metal grid 60x60x25 mm3
average Dy Glasses : Particle tracking Particle Displacements, t = 30min metal grid 60x60x25 mm3 y strain rate 10-5 s-1
0 to 0.2% 0.2 to 0.4% 0.4 to 0.6% 0.6 to 0.8% + + + ? Glasses : Particle tracking Average Shear Increase time resolution ...
Find best Affine Deformation a, • so that Minimize mean-square difference D2 = i (di – aRi)2 Ri´ = Ri + aRi Glasses : Strain distribution Determine local shear strain t+Dt Time t Ri Ri´ Falk and Langer (1998) Strain tensor e : symmetric part of a
z z x x -y -y Glasses : Strain distribution Cumulative strain Time t0 t1 Ri Ri´ 1.6 % shear eyz -0.1 - 0.05 0 0.05 0.1
z z Ri Ri´´ x x -y -y Glasses : Strain distribution Cumulative strain Time t0 t2 3.0 % shear eyz -0.1 - 0.05 0 0.05 0.1
z z - - x - - y - - eyz 1 eyz~ r3 x / mm Glasses : Strain distribution Incremental strain Continuum elasticity z x eyz slope -3 (Hutchinson, Spaepen, Schall) eyz r / mm Identify volume of shear zone ~ 4 particles
1.6% z -x -y -1 - 0.5 0 0.5 1 -0.1 - 0.05 0 0.05 0.1 Glasses : Irreversible rearrangements Particle displacements individual particle displacements shear strain shear strain > 0.03 eyz (Dx2 + Dy2 + Dz2)½ / a
r0 1.3r0 t = 5 min t = 30 min t = 60 min Glasses : Irreversible rearrangements Nearest neighbor change 4 3 2 1 0 Radial distribution function at 1.6 % shear # lost nearest neighbors
1.6% z -x -y yz xy -0.6 -0.4 -0.2 0 0.2 0.4 0.6 Glasses : Strain distribution Nucleation of shear event 1.2->1.4 % 1.4->1.6 % Strain is initially in opposite direction
0.06 0.04 0.02 0 -0.02 -0.04 -0.06 Glasses : “Nucleation“ of shear events Modes of thermal fluctuations NO shear applied! eyz Strain distribution in subsequent 2.5 min intervals.
Local strain z = 12..15mm DV eyz 0 0.15 0.1 0.05 x 25 0 -0.05 -0.1 50 -0.15 0 25 50 y Glasses : “Nucleation“ of shear events Modes of thermal fluctuations NO shear applied! Energy W = ½ m ( 2eyz2 ) DV Boltzmann distribution f ~ exp{-mV/kBT} m = 0.056 Pa Shear Modulus
Glasses : “Nucleation“ of shear events “Activation volume“ E = Ef – t Nucleation energy: Energy cost of Shear Event Formation Energy gain due to applied stress t l: Lamé constant m: shear modulus n: Poisson ratio ½ (2meij2 + lekk2) dV t 2eyz dV
Ef = 14.5 kT Ef = 32.9 kT Ef – t = 12.5 kT Ef – t = 29.5 kT 0.2 t = 2.0 kT t = 3.0 kT 0.1 0 -0.1 -0.2 Glasses : “Nucleation“ of shear events “Activation volume“ E = Ef – t Nucleation energy: Energy cost of Shear Event Formation Energy gain due to applied stress t Activation volume: = 4.5 V0
Glasses : “Nucleation“ of shear events “Activation volume“ E = Ef – t Nucleation energy: Integration with e0=0.08 Ef = 18 kT E = 16.5 kT t = 1.5 kT Nucleation rate: J = n f0 exp(-E/kT) E = 18.5 kT (1/300) s-1 #particles 3500 attempt frequency 100 s-1
z=16mm z = 0...20mm Glasses : Shear strain network Coupling through elastic field induces new shear zones
Strong Fragile Colloids don’t behave like molecular glasses Hard sphere colloids are always fragile
PNIPAM H H - CH - C - - CH - C - Microgel particles are deformable “Volume” fractions can be greater than 1 2 n N COOH C O Control elasticity to determine deformability NH CH CH CH 3 3 Increase stiffness of microgels Microgel particles D D~70 nm Interpenetrating network ofPNIPAM&polyacrylic acid PAAc T
Dynamic relaxation Stiffer Softer
Scaled dynamic structure factors Stiffer b ~ 0.6 Softer b ~ 0.8
Comparison to molecular glasses Strong Fragile