Download
1 / 68
690 likes | 730 Views
Explore the impact of resource abundance on economic development, examining historical cases, policy proposals, and sustainable management strategies. Learn about positive and negative experiences, the Dutch Disease phenomenon, and the four key explanations for the resource curse. Discover how countries like Botswana and Norway have successfully managed their resource wealth, and understand the pitfalls of corruption and conflict associated with abundant resources. Gain insights into the role of financial development, volatility, and diversification in effectively harnessing natural resources for long-term growth. Engage with expert analysis and practical lessons for policymakers and stakeholders in resource-rich nations.

E N D
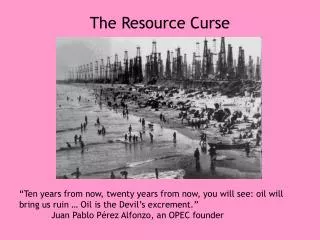
POLITICAL ECONOMY OF THE NATURAL RESOURCE CURSERick van der PloegOxCarre, University of Oxford
OVERVIEW OF TALK • Historical and case-study evidence of resource curse • Four explanations of resource curse • Cross-country and panel evidence • Focus on role of volatility and financial development • Sustainable management of natural resources, Hartwick rule and genuine saving • Policy proposals • Summing up
POOR DESPITE NATURAL RESOURCE WEALTH • Nigeria: oil revenues per capita increased from $33 in 1965 to $325 in 2000 but income per capita stagnated at about $1100 since its independence in 1960. Between 1970 and 2000 those on less than $1/day increased from 26 to almost 70%. Top 2% had as much as bottom 17 % in 1970 but staggering bottom 55% in 2000. Declining TFP growth: -1.2% per year. Only a third of capacity is utilized. Successive military dictatorships have plundered oil wealth. • Hopefully, the future will be brighter.
Source: World Bank Development Indicators 2006 (2000 US $) and International Country Risk Guide, The PRS Group Inc.
DISAPPOINTING PERFORMANCE DESPITE NATURAL RESOURCES • 17th century Spain despite gold/silver from New World. Resource Holland did much better. • Negative growth rates during past decades: e.g., Venezuela, Iran,Libya, Kuwait, Quatar. • Decline in OPEC GDP/ capita during last few decades while other countries enjoyed growth. • Gold boom in 70’s did not help South Africa much (Stokke, 2005). • Dutch economy and the Slochteren natural gas reserves led to unsustainable welfare state.
NEGATIVE PARTIAL CORRELATION BETWEEN ECONOMIC GROWTH AND RESOURCE ABUNDANCE (not for food or agriculture exports) Source: World Bank Development Indicators 2006
POSITIVE EXPERIENCES • Botswana: 40% of GDP stems from diamonds but has second highest education/GNP and highest growth rates since 1965. GDP/capita is ten times that of Nigeria. Still, inequality is high as it was during the colonial period. • Norway had huge growth in oil exports since 1971 and third largest exporter after Saudi-Arabia, but has fared fairly well. • United Arab Emirates also turned curse into blessing by investing in modernizing infrastructure and investing in welfare state and free access to education. • Mineral abundance US mid 19th to mid 20th century explains much of subsequent growth: driven by learning, IRTS and US government claimed no ultimate title to mineral rights (Habbakuk, 1962; David and Wright, 1977; Wright and Czelusta, 2004). Also, Germany and UK late 19th century. • Lessons: avoid corruption, diversify, education, and exploit complementarities linkages of manufacturing with resource sector.
RESOURCE ABUNDANCE ASSOCIATED WITH (Gylfason and Zoega, 2002): • Crowding out of non-resource exports and foreign direct investment. Less openness. • Elicits corruption and extreme rent seeking. • Crowds out foreign capital, social capital, human capital and financial capital. • Erodes legal system. • Bigger Gini index of inequality. • Less school enrolment and expected years of schooling (Botwana exception). • Delays development of financial institutions. • Armed conflicts and civil wars.
BUREAUCRATIC QUALITY AND RESOURCE ABUNDANCE
GOVERNMENT STABILITY AND RESOURCE ABUNDANCE
DOMESTIC CREDIT AND RESOURCE ABUNDANCE
EXTERNAL CONFLICT AND RESOURCE ABUNDANCE LIFE EXPECTANCY AND RESOURCE ABUNDANCE
FOUR EXPLANATIONS OF RESOURCE CURSE • I. Old Dutch disease stories • II. Volatility • III. Bad policies • IV. Rent seeking, corruption and conflict
I. OLD EXPLANATIONS OF RESOURCE CURSE • Windfall gain in demand for resources from abroad induces an appreciation of the real exchange rate. • The non-resource export sectors go in decline. • The sheltered sector gets a boost as labour and other factors move from traded to sheltered sectors. • Easy to extend to Heckser-Ohlin and factor use in resource sector (Corden and Neary, EJ, 1982; Corden, OEP, 1984) • Or to nominal wage rigidity in Dornbusch-style models of the open economy (Eastwood and Venables, EJ, 1982; Buiter and Purvis, 1983)
Is there a Dutch Disease? • ‘It seems ungrateful to talk of a disease’ (The Economist). Dutch Disease? • Decline of exposed sectors may just be the efficient response to the resource boom. • However, if there is learning by doing in the non-resource export sectors, there may well be a loss in output and welfare (van Wijnbergen, EJ, 1984; Krugman, JDE, 1987). A lower growth rate may well result (Sachs and Warner, 1997).
Worsening of competitiveness • P G(LN) = H F(1 LN) with H HT /HN is LM locus, which slopes upwards in P-LN space • Higher natural resource exports Q E boosts P and induces more than proportionate income in national income Y • Boost to output and consumption of NT-sector • Consumption of T-goods rises despite contraction of T-sector (supplied through imports paid for by resource revenues)
Dynamic effects of a resource boom: AAAB • On impact resource boom leads to real appreciation (higher P), decline of exposed sector and boom of sheltered sector • As relative productivity of labour in T-sector gradually falls, the real exchange rate depreciates (falling P) so labour shifts back from sheltered to exposed sectors • In the long run there must be real depreciation
Natural resource abundance reduces competitiveness Relative price of non-traded goods LM LM A A A NTGME NTGME B NTGME Fraction of labour in non-traded sector Higher resource exports shifts A to A, so induces appreciation of real exchange rate. With passing of time relative productivity of traded relative to that of non-traded sector declines if e. of s. between traded and non-traded goods is less than unity. This shifts equilibrium from A to A and eventually all the way to B. In the long run there is a real depreciation and allocation of labour returned to original level.
Extraction of natural resources requires labour and capital Resource movement as well as spending effects of resource boom. Labour is drawn both out NT and T to resource sectors. • Within context of Heckscher-Ohlin the Rybczynski theorem implies output of K-intensive non-resource sector expands. • If T-sector is K-intensive, resource boom induces pro-industrialisation if spending effect is not too large.
II. VOLATILITY & RESOURCE CURSE • ‘What commodity price lack in trend, they make up for in variance’ (Deaton, JEcPersp, 1999). • Resource rich economies are extremely vulnerable to the high volatility of resource prices, especially as supply is fairly inelastic. • Particularly bad as many resource rich economies are not much diversified: specialised in resources and small sheltered sector. In fact, they specialise away from non-resource traded goods which causes even more volatility and interest rate rises! Traded sector shrinks until it vanishes (Hausmann & Rigobon, 2002). • Volatility also bad for growth, investment, income distribution, poverty and educational attainment (Ramey & Ramey, Aizenman & Marion, Flug et al)
Declining natural resource dependence in the global economy Source: World Bank Development Indicators, 2005, World Bank
III. RESOURCES ENCOURAGES UNSUSTAINABLE POLICIES • Erosion of critical faculties of politicians. • Netherlands in the seventies dressed up the welfare state and governments since 1989 have been trying to have a sustainable welfare state. • Induces excessive borrowing (Manzano and Rigobon, 2002) & invest in ‘prestige’ projects. • Loose sight of growth-promoting policies and value-for-money management. • State-led industrialisation through import substitution and heavy subsidies for manufacturing.
IV. RESOURCES RENT SEEKING, CORRUPTION & CONFLICT • Allocation of talent: countries with many rent seekers and lawyers grow more slowly than countries with lots of engineers (Murphy et al, JPE, 1989; AER, 1993) • Voracity effect: drag on economic growth (Tornell and Lane, 1999). Applies theory of common pool. • Corruption, political instability, bureaucratic inefficiency, assassinations and conflict also hamper economic growth (Mauro, 1995; Leite and Weidmann, 1999). Bad effects of resource growth mainly operates via worsening of institutions, rule of law, etc. • Increases civil strife and wars, especially in sub-Saharan Africa thru’ weakening of state or finance of rebels (Collier and Hoeffler, 2004; Ross, 2004). War lord competition (Skaperdas, 2004). Distinguish between grievance and greed (Ollson and Fors, 2004). • Especially bad for point-based rather than diffuse resources.
RENT GRABBING VERSUS PRODUCER FRIENDLY INSTITUTIONS (Mehlum, Moene and Torvik, EJ, 2005) Key: A resource bonanza shifts equilibrium from A to A if there are strong institutions, which means higher profits and more entrepreneurs. In case of weak institutions the equilibrium shifts from A to A, so profits decline and number of rent seekers increases.
CROSS-COUNTRY EVIDENCE FOR RESOURCE CURSE • Sachs and Warner (1997) • Mehlum, Moene and Torvik (2005) • Boschini et al (2003) • Arezki and van der Ploeg (2007)
EFFECTS OF RESOURCE ABUNDANCE AND INSTITUTIONAL QUALITY ON ECONOMIC GROWTH
CROSS-COUNTRY EVIDENCE • Only countries with • poor institutions • suffer from resource • curse • Implies = 0.32, • = 0.0046 and half-time 15 years Source: World Bank Development Indicators 2006 International Country Risk Guide, PRS Group plc. Sachs and Warner (1997)
Marginal effects of different types of natural resources on growth for different levels of institutional quality Source: Boschini, et. al. (2003)
VOLATILITY, FINANCIAL DEVELOPMENT AND THE NATURAL RESOURCE CURSE • Based on work with Steven Poelhekke
Motivation • Output volatility seems to matter for growth. (e.g., Ramey & Ramey, AER, 1995) • What explains volatility? Or its absence? • Why do so many resource rich countries stay poor? • Is the resource curse cast in stone? • Can volatility explain the curse?
The Facts • Volatile countries have lower growth (Figure 1)
The Facts: s.d. real GDP growth (Table 1) • Developing countries are more volatileSub-Saharan Africa: 6.52 Western Europe: 2.33 Middle East/North Africa: 8.12! North America: 1.90 • Countries with poorly developed financial systems are more volatile1th Q (<16.2%): 6.404th Q (>52.9%): 4.40 • Remote (distance from waterway) countries are more volatile1th Q (<49km): 6.524th Q (>359km): 8.12
The Facts (Figure 2) • Resource dependent countries are more volatile
The literature • Ramey & Ramey, AER, 1995: volatility affects growth • Koren, Tenreyro, QJE, 2007: volatility falls with development as countries diversify away from highly volatile sectors and improve macro-policy. • Blattman, Hwang, Williamson, JDE, 2007: resource exporters have volatile terms of trade, less FDI, less growth (1870-1939) • Sachs & Warner, 1997: windfall resource revenue -> RER appreciation -> decline in non-resource exports -> less learning by doing and lower TFP growth
Key questions • Does volatility affect growth negatively? • Does resource dependence explain output volatility? • A new explanation for the resource curse? • Do financial development and openness mitigate any adverse effects? • ML to simultaneously explain volatility of unanticipated output shocks and its effect on growth.
How can volatility hamper growth? • Aghion at. al., CEPR 2006: RER volatility with credit constraints stunts innovation • nominal exchange rate volatility: liquidity shock • Here: shock = exogenous World commodity price (Cashin et. al., IMF, 2002) cash = profits + resource income - nominal wage stickiness
Results: • If F(z) is concave so that E[F(·)] F(E[·]),then more volatility in natural resource revenues or in nominal exchange rate lowers innovation and growth, unless financial development is very large. • High and stable resource revenues and also a stable nominal exchange rate ease constraints and boost growth.
If F(z) is concave so that E[F(·)] F(E[·]), more volatility lowers innovation and growth unless financial development is very large. Figure 3:
Other links between output volatility and growth • Higher volatility means more uncertainty-induced errors and thus less irreversible investment and lower growth (Bernanke, QJE, 1983; Pindyck, 1991; Aizenman and Marion, RIE, 1991) • Especially if it is costly to switch factors of production(Bertola, JME, 1994; Dixit and Rob, JET, 1994) • Or: higher volatility leads to more precautionary saving and thus more investment and growth (Mirman, Etrica, 1971) • Higher variance commands investments with higher return and thus higher growth (Black, 1987) • Net effect of volatility on growth can in theory be negative or positive, so needs to be settled empirically
Data • Heston, Summers, Aten, Penn World Tables 6.2 • Human capital: Barro & Lee (average schooling years in population age 25+) • Resources: World Development Indicators (export revenue as % GDP) • Openness: Sachs & Warner dummy (Wacziarg, Welch, 2003) • Financial development: WDI (domestic credit to private sector) • Distance to coast/river: Center for International Development (km)
IV: Endogenous Investment • Unobserved country characteristics may determine the investment share and growth simultaneously (notably institutions) • Growing countries may attract more investment • IVs - ethnolinguistic fractionalization & polarization (Montalvo, Reynal-Querol, JDE & AER 2005) less trust, more corruption, less political rights (Alesina et al, JEG, 2003) - % pop. in temperate climate (Gallup et al, 1999; CID)
Direct Resource Effect: Curse or blessing? • Resource rents: -0.316** • Resource rents × financial development: +1.106*** • Resource rents × openness: +0.243*** • Continuous interactions: size and significance of resource effect on growth depends on initial levels of financial development and openness.