Download
1 / 21
210 likes | 297 Views
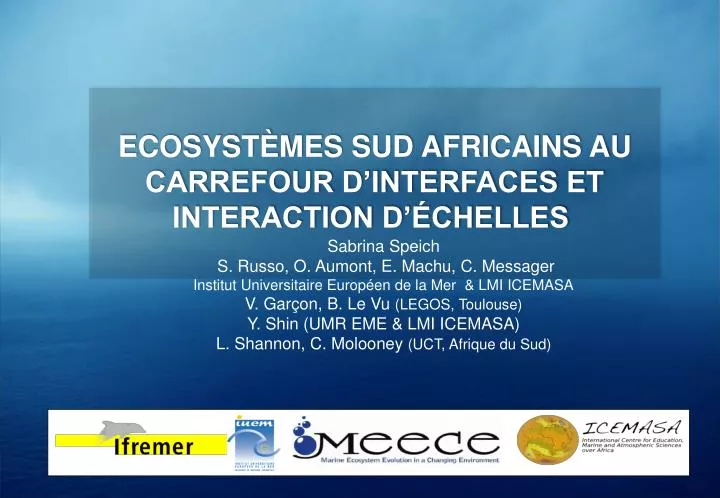
Ecosystèmes sud africains au carrefour d’interfaces et interaction d’échelles . Sabrina Speich S. Russo, O. Aumont, E. Machu, C. Messager Institut Universitaire Européen de la Mer & LMI ICEMASA V. Garçon, B. Le Vu (LEGOS, Toulouse) Y. Shin (UMR EME & LMI ICEMASA)

E N D
Ecosystèmes sud africains au carrefour d’interfaces et interaction d’échelles Sabrina Speich S. Russo, O. Aumont, E. Machu, C. Messager Institut Universitaire Européen de la Mer & LMI ICEMASA V. Garçon, B. Le Vu (LEGOS, Toulouse) Y. Shin (UMR EME & LMI ICEMASA) L. Shannon, C. Molooney (UCT, Afrique du Sud)
Coordinator: Icarus Allen Plymouth Marine Laboratory (PML), UK meece@pml.ac.uk | www.meece.eu MEECE is a FP7 Integrated Project which aims to push forward the state-of-the-art of our understanding of impacts of global climate change and direct anthropogenic drivers on marine ecosystems end to end The specific goals of MEECE are: • To improve the knowledge base on marine ecosystems and their response to climate and anthropogenic driving forces • To develop innovative predictive management tools and strategies to resolve the dynamic interactions of the global change driver, changes in ocean circulation, climate, ocean acidification, pollution, over fishing and alien invasive species on the structure and functioning of marine ecosystems
MEECE integrated ecosystem changes approach meece@pml.ac.uk www.meece.eu
Climate Global Models:underestimation of climate subsystem processes Emission scenarios Global Climate Models not yet adequate to reproduce the whole spectra of atmospheric, oceanic and air-sea exchanges processes HadCM3 SST error (model-simulated)
Modeling approaches to ‘downscaling’ from global to regional scale • using a regional climate model (RCM) – often referred to as ‘dynamical downscaling’. Note that this involves a two-step process, driving RCM at its boundaries by results from a GCM. • making use of empirical relationships between large and smaller scales based on historical observations – referred to as ‘statistical downscaling’. Note that this requires long-term and high-quality observations at the location/region in question. • using a ‘stretched grid’ global model, with high resolution over the domain of interest and lower resolution elsewhere. Note that this poses challenges for physical parameterizations, flow distortion, etc., but avoids problems at boundaries. • use global climate model to produce ‘high resolution time slices’. Note that this avoids boundary problems, but there may be issues with initial conditions, parameterizations, ocean boundary conditions, etc. • using a regional climate model (RCM) – often referred to as ‘dynamical downscaling’. Note that this involves a two-step process, driving RCM at its boundaries by results from a GCM. • making use of empirical relationships between large and smaller scales based on historical observations – referred to as ‘statistical downscaling’. Note that this requires long-term and high-quality observations at the location/region in question. • using a ‘stretched grid’ global model, with high resolution over the domain of interest and lower resolution elsewhere. Note that this poses challenges for physical parameterizations, flow distortion, etc., but avoids problems at boundaries. • use global climate model to produce ‘high resolution time slices’. Note that this avoids boundary problems, but there may be issues with initial conditions, parameterizations, ocean boundary conditions, etc. but climate predictions & projections must be done at global scale, because the system’s response is fundamentally global
Climate Scenario Downscaling First step: A dynamical downscaling of the ocean using the Regional Ocean Model System (ROMS) Dynamical downscaling runs regional (climate) models in reduced (regional) domain with boundary conditions given by the (AR4) GCMs Russo & Speich in prep.
Climate Scenario Downscaling Second step: A statistical calibration of the climate (IPSL A1B) scenario Hyp.: Find an empirical function T that downscales (or corrects the model outputs) cumulative distribution function (CDF) of a climate variable from large- (the predictor) to local-scale (the predictand) by applying an equivalent of proportionality transformation1 COADS Russo & Speich in prep. 1Michelangeli et al. 2009
Climate Scenario Downscaling Future steps: Improving the physical downscaling by using a coupled atmosphere-ocean regional system forced at boundaries by the statistically corrected AR4 (AR5) GCMs; Adding the biogeochemistry components to the regional coupled system (NPZD, ecosystems, end-to-end models) Implementing a full coupled regional system(including land biosphere, hydrology, atmosphere chemistry, etc.) ? Latent Heat Flux SouthernAfrica 25°S WRF forced by OSTIA SST 30°S 40°S Coupled simulation WRF-ROMS 45°S 50°S 10°W 0 10°E 20°W 30°W
Min-Max limits for the size pred/prey ratio Spatio-temporal co-occurrence • Application to South Benguela for 1990-1997 • 11 explicit species • ¾ fish biomass • >90% of captures 0.15° x 0.15° Ratio max Prey size Ratio min Predator size Variable structure of the trophical network Opportunist predation: buffer role SOUTH AFRICA OSMOSE Model (high trophical levels) in the Benguela • Model dimensions: • Abundance and Biomass by: • Species • Age • Size • Space unit • Time unit
Ex : hareng Age 0 – sem 1 Ex : hareng Age 3+ OSMOSE: Modelling the life cycle Processes (x-1,y-1) (x,y-1) (x+1,y-1) 1 Spatial distribution 2 Natural mortality (x-1,y) (x,y) 3 Explicit predation 4 3 Growth or Mortality by starving 4 5 Mortality by fishing 2 5 6 Reproduction 6 1 (x+1,y+1) (x,y+1) 1 1
1 Predation mortality 2 1 One-way coupling = Forcing Two-way coupling (feedback) = Coupling 2 Forcing & Coupling: ROMS-NPZD-OSMOSE Travers et al. 2009. Ecol. Model. Food availability (x,y,t,size) ROMS-NPZD OSMOSE Natural mortality Copepods Ciliates Diatoms Flagellates Predation Reproduction Ammonium Nitrates ξ Fishing mortality Starvation mortality Small Detritus Large Detritus Growth • Parametrization • Shin et al. 2004. S. Afr. J. Mar. Sci. • Travers et al. 2006. Can. J. Fish. Aquat. Sci. • - Sensibility analyses • Ferrer 2008, Msc thesis • Calibration by genethic algorithm • Versmisse 2008, PhD thesis • Duboz et al. 2010. Ecol. Model. • Validation – POM approach • Travers 2010, PhD thesis • Crossed validation with Ecopath-Ecosim • Shin et al. 2004. S. Afr. J. Mar. Sci. • Travers et al., 2010. J. Mar. Sys. ROMS-NPZD coupling Travers et al., 2009. Ecol. Modelling Travers et Shin, 2010. Progress Oceanogr
MEECE integrated approach on the Benguela ecosystem Climate variability and impactS. Speich, S. Russo, E. Machu, O. Aumont, C. Messager (LPO IUEM), V. Garçon, B. Le Vu (LEGOS), Y. Shin (UMR EME), C. Mooloney (UCT) Two questions adressed: How climate change impacts the regional climate system ? How this affects the local ecosystems (adresses via different coupled systems: ROMS-NPZD-OSMOSE et ROMS-PISCES-APECOSM) Scenarios withfishing and climatevariabilityY. Shin (UMR EME), L. Shannon (UCT) Three questions willbeaddressed in the Benguela, usingRoms-Npzd-Osmose and EwE: How wouldclimate change affects fishingreferencelevels? Wouldclimate change and fishing scenarios modify the trophic structure of the ecosystem? To whatextent are ecologicalindicators of fishingeffects sensitive and exclusive to fishing pressure (vs sensitive to climate forcing)? Would climate change and fishing scenarios modify the trophic structure of the ecosystem? Shift between different alternative trophic pathways?
Comparing ecological indicators across world’s marine ecosystems In blue, the first 19 ecosystems considered in the IndiSeas WG. In yellow, the participating countries the IndiSeas Working Group www.indiseas.org • OBJECTIVES • The IndiSeas WG was established in 2005 under the auspices of EUROCEANS to: • Develop a set of synthetic ecological indicators; • Build a generic dashboard using a common set of interpretation and visualisation methods; • Evaluate the exploitation status of marine ecosystems in a comparative framework A suite of papers published in ICES Journal of Marine Science (2010) presents initial results of comparative analyses of the 19 fished marine ecosystems (Shin and Shannon 2010; Shin et al. 2010a). The IndiSeas WG relies strongly on a multi-institutional collaboration for assembling a common dataset, and for allowing the global comparative approach to keep a good track of the data which underlie the indicators, and to account for the local scientific knowledge in the final diagnosis. The first phase of the WG (2005-2009) assembled the expertise of 31 scientific experts around the world, from 21 research institut Yunne-Jai SHIN IRD, UMR EME 212 shin@ird.fr Lynne SHANNON UCT, Zoology Dpt Lynne.Shannon@uct.ac.za
Comparing ecological indicators across world’s marine ecosystems For each ecosystem, a synthetic overview is displayed with state and trends indicators. A summary diagnosis is provided by each ecosystem expert. Viewing options include time series for each indicator, descriptions of ecosystem and key species. Yunne-Jai SHIN IRD, UMR EME 212 shin@ird.fr Lynne SHANNON UCT, Zoology Dpt Lynne.Shannon@uct.ac.za The IndiSeas website The website www.indiseas.orghas been developed as a platform to disseminate the results of the analyses beyond the scientific audience. It is intended to inform scientists, managers, policy makers and the public at large of the state of the world’s marine ecosystems as a result of fisheries exploitation. • Next steps • Building bridges with other scientific fields • To strengthen the ecosystem diagnosis, additional indicators from other scientific fields need to be considered, allowing to: • Quantify the joint effects of climate and fishing changes • Integrate conservation and biodiversity issues • Integrate socio-economic issues • Testing the performance of ecosystem indicators in fisheries management • Performance testing will allow to assess whether an indicator and accompanying decision rules actually guide decision-makers to make the “right” decision, in hindsight. The suite of indicators collected by the Indiseas WG provides a unique opportunity to test their performance across a range of ecosystems. • Developing reference levels for indicators • Establishing reference levels for ecosystem indicators has proven to be a major challenge to implementing EAF, due to the complexity of ecosystems and their response to fishing in a changing environment. Ecosystem models (EwE, Osmose, Atlantis) will be used for identifying baseline unexploited reference levels and limit reference levels.
Quel est l’effet de la rétroaction? 4.104 Forçage Couplage 2.8 10-3 3.104 Diatomées Diatomées 2.104 2.6 10-3 1.104 2.4 10-3 Biomasse (t) 6 10-3 Predation mortality rate on copepods (day-1) 5 10-3 4 10-3 3 10-3 2 10-3 Couplage = moins de plancton dans la zone de nourricerie 1 10-3 Travers et al. 2009 - Ecol. Model. Forçage/couplage ROMS-NPZD et OSMOSE Spatio-temporal variation of fish-induced mortality on plankton Predation mortality rate on copepods (d-1) Travers et Shin 2010 - Progr.Ocean.
Life-history migration Benguela current Agulhas current Weeks et al. 2006 Hutchings et al. 2002 Vers des scénarios prospectifs dans le Benguela sud • - Des scénarios d’Aires Marines Protégées (ANR AMPED, coord. D. Kaplan) • Avec Y. Shin (UMR EME), D. Yemane (MCM), C. van Der Lingen (MCM), N. Bez (IRD) • Deux effets à tester avec ROMS-NPZD-OSMOSE: 1- Variabilité spatiale des réseaux trophiques 2- Changements d’habitats des espèces exploitées (scénarios IPCC) The samespeciesoccur in the South and West coastssomany interactions between the 2 zones
1) How would climate change affects fishing reference levels? • Simulate FMSY present conditions (already done in MSC LTLWG – T. Smith), and compare with simulations under IPCC scenarios (at least A1B, time slice 2080-2100) • For a set of key target species (monospecies approach). In the Benguela: anchovy, sardine, redeye, horse mackerel, shallow water hake, deep water hake
2) Would climate change and fishing scenarios modify the trophic structure of the ecosystem? Shift between different alternative trophic pathways? • Combined fishing and IPCC scenarios. 4 fishing scenarios: • F status quo • Increase in F(global), F(small pelagics), F(large demersals)
2) Sensitivity and responsiveness of ecological indicators to fishing vs climate forcing indicator ? Linear decrease ? ? Environmental noise ? Set of indicators to be tested: Mean size of fish, proportion of predatory fish, mean lifespan, 1/CV tot biomass, tot B, TL landings Fishing mortality F • Theoretical climate and fishing forcing: • - Implement present climate conditions, increase in wind stress (trend), interannual variability • multiplier of F(global) • F(small pelagics): 0 to Fdepletion • F(demersal fish): 0 to Fdepletion