Download
1 / 1
10 likes | 174 Views
polyI:C. CpG. LPS. 0.32. 2.35. 0.92. 3.04. 0.83. 2.09. SSC. 95. 2.36. 92.8. 3.22. 95.2. 1.89. untreated. 0.65. 2.69. PI. 95.1. 1.56. A. polyI:C. CpG. LPS. untreated. 72.7. 66.1. 65.8. 69.6. FSC. B. Annexin V. Supplementary Figure 1

E N D
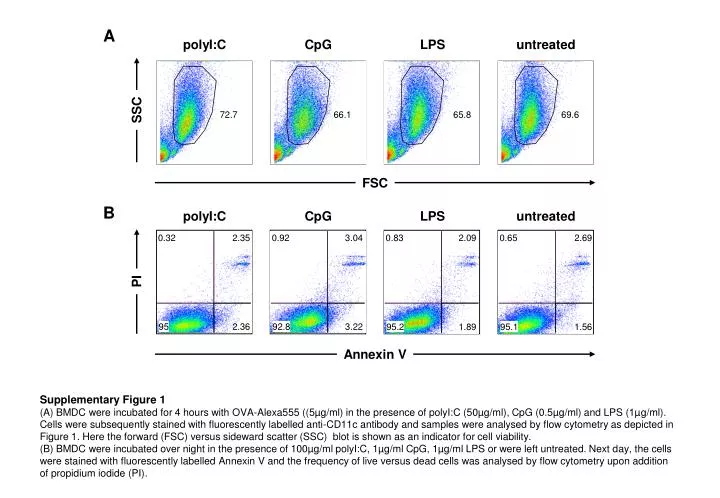
polyI:C CpG LPS 0.32 2.35 0.92 3.04 0.83 2.09 SSC 95 2.36 92.8 3.22 95.2 1.89 untreated 0.65 2.69 PI 95.1 1.56 A polyI:C CpG LPS untreated 72.7 66.1 65.8 69.6 FSC B Annexin V Supplementary Figure 1 (A) BMDC were incubated for 4 hours with OVA-Alexa555 ((5µg/ml) in the presence of polyI:C (50µg/ml), CpG (0.5µg/ml) and LPS (1µg/ml). Cells were subsequently stained with fluorescently labelled anti-CD11c antibody and samples were analysed by flow cytometry as depicted in Figure 1. Here the forward (FSC) versus sideward scatter (SSC) blot is shown as an indicator for cell viability. (B) BMDC were incubated over night in the presence of 100µg/ml polyI:C, 1µg/ml CpG, 1µg/ml LPS or were left untreated. Next day, the cells were stained with fluorescently labelled Annexin V and the frequency of live versus dead cells was analysed by flow cytometry upon addition of propidium iodide (PI).