Download
1 / 23
230 likes | 322 Views
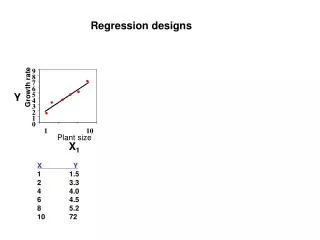
9. 8. 7. Growth rate. 6. Y. 5. 4. 3. 2. 1. 0. Regression designs. 1. 10. Plant size. X 1. X Y 1 1.5 2 3.3 4 4.0 6 4.5 8 5.2 10 72. 9. 9. 8. 8. 7. 7. Growth rate. Growth rate. 6. 6. Y. Y. 5. 5. 4. 4. 3. 3. 2. 2. 1. 1. 0. 0. 1. 10. Plant size. X 1.

E N D
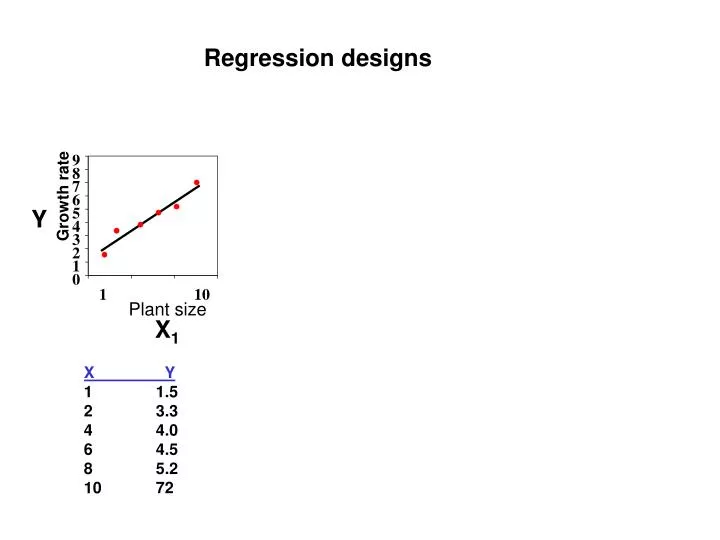
9 8 7 Growth rate 6 Y 5 4 3 2 1 0 Regression designs 1 10 Plant size X1 X Y 1 1.5 2 3.3 4 4.0 6 4.5 8 5.2 10 72
9 9 8 8 7 7 Growth rate Growth rate 6 6 Y Y 5 5 4 4 3 3 2 2 1 1 0 0 1 10 Plant size X1 Regression designs 1 10 Plant size X1 X Y 1 1.5 2 3.3 4 4.0 6 4.5 8 5.2 10 72 X Y 1 0.8 1 1.7 1 3.0 10 5.2 10 7.0 10 8.5
9 9 9 8 8 8 7 7 7 Growth rate Growth rate Growth rate 6 6 6 Y Y Y 5 5 5 4 4 4 3 3 3 2 2 2 1 1 1 0 0 0 0 1 1 10 Plant size Plant size X1 X1 Regression designs Code 0=small, 1=large 1 10 Plant size X1 X Y 1 1.5 2 3.3 4 4.0 6 4.5 8 5.2 10 7.2 X Y 1 0.8 1 1.7 1 3.0 10 5.2 10 7.0 10 8.5 X Y 0 0.8 0 1.7 0 3.0 1 5.2 1 7.0 1 8.5
9 8 7 Growth rate 6 Y 5 4 3 2 1 0 0 1 Plant size X1 Code 0=small, 1=large Growth = m*Size + b Questions on the general equation above: 1. What parameter predicts the growth of a small plant? 2. Write an equation to predict the growth of a large plant. 3. Based on the above, what does “m” represent? X Y 0 0.8 0 1.7 0 3.0 1 5.2 1 7.0 1 8.5
Growth of small Difference in growth 9 8 7 Growth rate 6 Y 5 4 3 2 1 0 0 1 Plant size X1 Code 0=small, 1=large Growth = m*Size + b If small Growth = m*0 + b If large Growth = m*1 + b X Y 0 0.8 0 1.7 0 3.0 1 5.2 1 7.0 1 8.5 Large - small = m
Two (or more) X variables: Both categorical …………... ANOVA One categorical, one continuous……………...ANCOVA
ANCOVA In an Analysis of Covariance, we look at the effect of a treatment (categorical) while accounting for a covariate (continuous) Fertilized P Fertilized N Growth rate (g/day) Plant height (cm)
Fertilized P Fertilized N ANCOVA Fertilizer treatment (X1): code as 0 = N; 1 =P Plant height (X2): continuous Growth rate (g/day) Plant height (cm)
? Fertilized P Fertilized N ? ANCOVA Fertilizer treatment (X1): code as 0 = N; 1 = P Plant height (X2): continuous X1*X2 0 0 : 1 2 5 X1 X2 Y 0 1 1.1 0 2 4.0 : : : 1 1 3.1 1 2 5.2 : : : 1 5 11.3 Growth rate (g/day) Plant height (cm)
ANCOVA • Fit full model (categorical treatment, covariate, interaction) Y=m1X1+ m2X2 +m3X1X2 +b Fertilized P Fertilized N Growth rate (g/day) Plant height (cm)
ANCOVA • Fit full model (categorical treatment, covariate, interaction) • Y=m1X1+ m2X2 +m3X1X2 +b • Questions: • Write out equation for N fertilizer (X1= 0) • Write out equation for P fertilizer (X1 = 1) • What differs between two equations? • If no interaction (i.e. m3 = 0) what differs between eqns?
If X1=0: Y=m1X1+ m2X2+m3X1X2 +b Difference if no interaction: m1 +m3X2 ANCOVA • Fit full model (categorical treatment, covariate, interaction) • Y=m1X1+ m2X2 +m3X1X2 +b If X1=1: Y=m1 + m2X2 +m3X2 +b Difference: m1 +m3X2
Difference between categories…. Constant, doesn’t depend on covariate Depends on covariate = m1 + m3X2 (interaction) = m1 (no interaction) 12 10 8 Growth rate (g/day) Growth rate (g/day) 6 4 2 0 0 2 4 6 Plant height (cm) Plant height (cm)
ANCOVA • Fit full model (categorical treatment, covariate, interaction) • Test for interaction (if significant- stop!) If no interaction, the lines will be parallel Growth rate (g/day) Plant height (cm)
ANCOVA • Fit full model (categorical treatment, covariate, interaction) • Test for interaction (if significant- stop!) • Test for differences in intercepts between lines = m1 } m1 Growth rate (g/day) No interaction Intercepts differ Plant height (cm)
Multiple X variables: Both categorical …………... ANOVA One categorical, one continuous……………...ANCOVA Both continuous …………....?
Higher nutrient trees Lower nutrient trees Multiple regression Herbivore damage Tree age Damage= m1*age + b
Herbivore damage Tree age Residuals of herbivore damage Tree nutrient concentration
Damage= m1*age + m2*nutrient + b Herbivore damage Tree age Residuals of herbivore damage Tree nutrient concentration
No interaction (additive): Interaction (non-additive): y y Damage= m1*age + m2*nutrient + m3*age*nutrient +b
X1 X2 Non-linear regression? Just a special case of multiple regression! X X2 Y 1 1 1.1 2 4 2.0 3 9 3.6 4 16 3.1 5 25 5.2 6 36 6.7 7 49 11.3 Y = m1 x +m2 x2 +b Y = m1 x1 +m2 x2 +b
Regression’s deep dark secret: Order matters! Input: height p=0.001 weight p=0.34 age p=0.07 Input: height p=0.001 age p=0.04 weight p=0.88 Why? In the first order, even though weight wasn’t significant, it explained some of the variation before age was tested. Common when x-variables are correlated with each other.
Solutions? 1) Use a logical order. For example in ANCOVA it makes sense to test the interaction first 2) Stepwise regression: “tries out” various orders of removing variables.