Download
1 / 1
10 likes | 183 Views
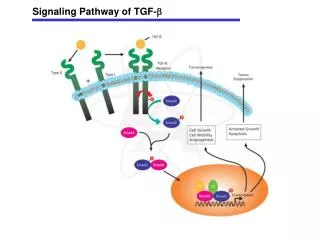
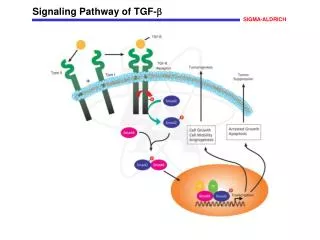
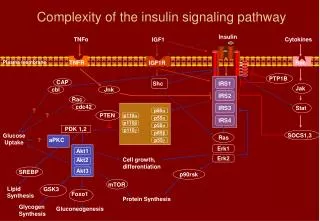
Development of a Signaling Pathway Map for the FXM. Gil Sambrano, Lily Jiang, Madhu Natarajan, Alex Gilman, Adam Arkin University of California San Francisco, University of Texas Southwestern Medical Center, and University of California Berkeley.

E N D
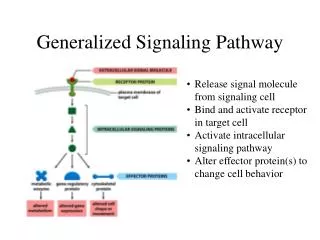
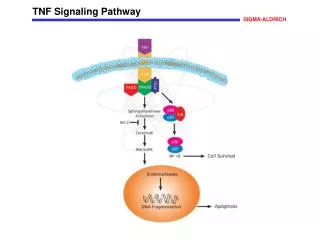
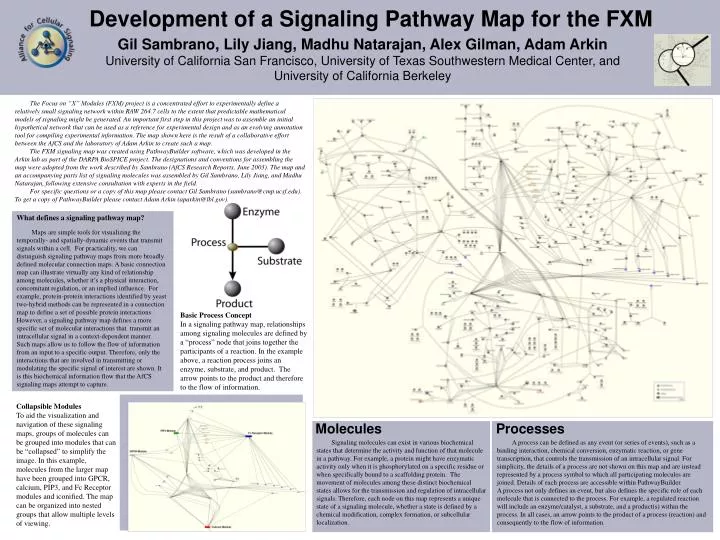
Development of a Signaling Pathway Map for the FXM Gil Sambrano, Lily Jiang, Madhu Natarajan, Alex Gilman, Adam Arkin University of California San Francisco, University of Texas Southwestern Medical Center, and University of California Berkeley The Focus on “X” Modules (FXM) project is a concentrated effort to experimentally define a relatively small signaling network within RAW 264.7 cells to the extent that predictable mathematical models of signaling might be generated. An important first step in this project was to assemble an initial hypothetical network that can be used as a reference for experimental design and as an evolving annotation tool for compiling experimental information. The map shown here is the result of a collaborative effort between the AfCS and the laboratory of Adam Arkin to create such a map. The FXM signaling map was created using PathwayBuilder software, which was developed in the Arkin lab as part of the DARPA BioSPICE project. The designations and conventions for assembling the map were adopted from the work described by Sambrano (AfCS Research Reports, June 2003). The map and an accompanying parts list of signaling molecules was assembled by Gil Sambrano, Lily Jiang, and Madhu Natarajan, following extensive consultation with experts in the field. For specific questions or a copy of this map please contact Gil Sambrano (sambrano@cmp.ucsf.edu). To get a copy of PathwayBuilder please contact Adam Arkin (aparkin@lbl.gov). What defines a signaling pathway map? Maps are simple tools for visualizing the temporally- and spatially-dynamic events that transmit signals within a cell. For practicality, we can distinguish signaling pathway maps from more broadly defined molecular connection maps. A basic connection map can illustrate virtually any kind of relationship among molecules, whether it’s a physical interaction, concomitant regulation, or an implied influence. For example, protein-protein interactions identified by yeast two-hybrid methods can be represented in a connection map to define a set of possible protein interactions. However, a signaling pathway map defines a more specific set of molecular interactions that transmit an intracellular signal in a context-dependent manner. Such maps allow us to follow the flow of information from an input to a specific output. Therefore, only the interactions that are involved in transmitting or modulating the specific signal of interest are shown. It is this biochemical information flow that the AfCS signaling maps attempt to capture. 1 Basic Process Concept In a signaling pathway map, relationships among signaling molecules are defined by a “process” node that joins together the participants of a reaction. In the example above, a reaction process joins an enzyme, substrate, and product. The arrow points to the product and therefore to the flow of information. Collapsible Modules To aid the visualization and navigation of these signaling maps, groups of molecules can be grouped into modules that can be “collapsed” to simplify the image. In this example, molecules from the larger map have been grouped into GPCR, calcium, PIP3, and Fc Receptor modules and iconified. The map can be organized into nested groups that allow multiple levels of viewing. Molecules Processes Signaling molecules can exist in various biochemical states that determine the activity and function of that molecule in a pathway. For example, a protein might have enzymatic activity only when it is phosphorylated on a specific residue or when specifically bound to a scaffolding protein. The movement of molecules among these distinct biochemical states allows for the transmission and regulation of intracellular signals. Therefore, each node on this map represents a unique state of a signaling molecule, whether a state is defined by a chemical modification, complex formation, or subcellular localization. A process can be defined as any event (or series of events), such as a binding interaction, chemical conversion, enzymatic reaction, or gene transcription, that controls the transmission of an intracellular signal. For simplicity, the details of a process are not shown on this map and are instead represented by a process symbol to which all participating molecules are joined. Details of each process are accessible within PathwayBuilder. A process not only defines an event, but also defines the specific role of each molecule that is connected to the process. For example, a regulated reaction will include an enzyme/catalyst, a substrate, and a product(s) within the process. In all cases, an arrow points to the product of a process (reaction) and consequently to the flow of information.