Download
1 / 6
60 likes | 195 Views
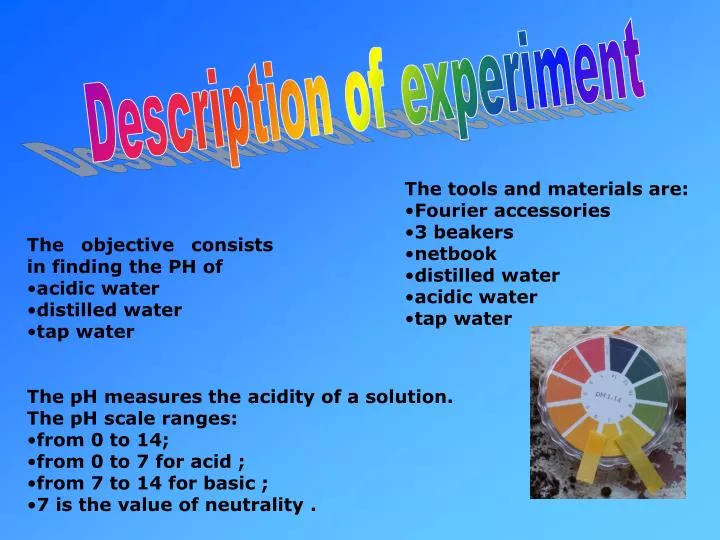
Description of experiment. The tools and materials are: Fourier accessories 3 beakers netbook distilled water acidic water tap water. The objective consists in finding the PH of acidic water distilled water tap water. The pH measures the acidity of a solution. The pH scale ranges:

E N D
Description of experiment • The tools and materials are: • Fourier accessories • 3 beakers • netbook • distilled water • acidic water • tap water • The objective consists in finding the PH of • acidic water • distilled water • tap water • The pH measures the acidity of a solution. • The pH scale ranges: • from 0 to 14; • from 0 to 7 for acid ; • from 7 to 14 for basic ; • 7 is the value of neutrality .
Graph PH of distilled water. This graph represents the ph of distilled water. The value of pH varies from 7 to 7.4: the distilled water is basic.
Graph PH of water tap. This graph represents the ph of tap water. The value of pH varies from 7.3 to 7.4: the distilled water is basic.
Graph PH of acid water. This graph represents the ph of acid water. The value of pH varies from 2.22 to 2.16: the distilled water is acid.
Conclusion The distilled water has the ph of 7, the tap water has ph between 7 to 8 and acid water has ph 2. The distilled and acid water decrease in time, while the ph of tap water increases . Note Ph sensor We have used the acid water solution instead of rainwater because it was impossible to collect real samples of rainwater.
Class 1 ^ A CAT T H A N K S S.y. 2010/11


![Experiment 1 Id Title Description Institution [Parameter Sets…]](https://cdn2.slideserve.com/3773607/slide1-dt.jpg)