Download
1 / 34
370 likes | 779 Views
Human Impact on Resources, Biodiversity, and Ecosystems. Types of Resources. natural resources – goods and services provided for by nature renewable resources – replaced naturally in a reasonable amount of time non-renewable resources commons – resources owned by everyone.

E N D
Types of Resources • natural resources – goods and services provided for by nature • renewable resources – replaced naturally in a reasonable amount of time • non-renewable resources • commons – resources owned by everyone
tragedy of the commons • renewable common resources which tend to be over-exploited • Why? • “if I don’t use them then someone else will so it might as well be me”
exploitation of resources • carrying capacity – the maximum size of a population that can be supported over the long term • maximum sustainable yield (MSY) – the greatest “use” of a renewable resource
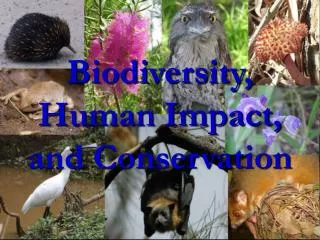
Human Impact on Biodiversity • species biodiversity – the total number of different kinds of species • genetic biodiversity – the total gene pool for a given species • biosphere biodiversity – the total number of species in existence - known species: 2 million - unknown species: 3 – 50 million
Value of BiodiversityWhy should we care about protecting other species? • Food agriculture and meat production has led to a decline in species biodiversity as well as genetic biodiversity • Medicine many modern medicines come from plant extracts * biopiracy
Value of Biodiversity cont. • ecosystem sustainability the greater the biodiversity, the greater the stability * keystone species • commercial value - ecotourism - recreation; hunting, fishing, wildlife watching - timber • intrinsic value preservationist philosophy – existence of other species has value aside from any use we make of it
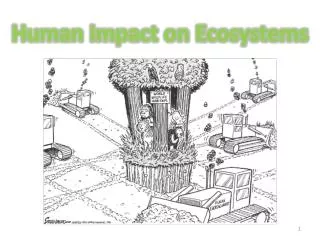
Human Causes of Biodiversity Decline • habitat destruction deforestation, wetlands destruction, development • introduction of exotic species most introduced species do not survive their new habitat – those that do, often out-compete native species (and are termed invasive)
humancauses continued … • overuse (hunting, fishing) * poaching • pollution * climate change
Reduced Ranges Indian Tiger Range 100 years ago Range today (about 2,300 left) Fig. 9-8a, p. 191
Reduced Ranges Black Rhino Range in 1700 Range today (about 2,400 left) Fig. 9-8b, p. 191
Deliberately Introduced Species Purple looselife European starling African honeybee (“Killer bee”) Nutria Salt cedar (Tamarisk) Marine toad Water hyacinth Japanese beetle Hydrilla European wild boar (Feral pig) Fig. 9-11a, p. 193
Accidentally Introduced Species Sea lamprey (attached to lake trout) Argentina fire ant Brown tree snake Eurasian muffle Common pigeon (Rock dove) Formosan termite Zebra mussel Asian long-horned beetle Asian tiger mosquito Gypsy moth larvae Fig. 9-11b, p. 193
Kudzu Fig. 9-12, p. 194
Fire Ant Invasion 1918 2000 Fig. 9-13, p. 195
Extinction Threats from Poaching • Profits of poaching • Causes of poaching: food, fur, pets, traditional medicines, trophies, eliminating pests, etc. • Bushmeat • Illegal pets and decorative plants
Bushmeat Fig. 9-15, p. 196
Confiscated Products From Endangered Species Fig. 9-18, p. 199
Extinction Threats from Climate Change and Pollution • Global Warming • Pesticide threats • DDT biomagnification (bioaccumulation)
Biomagnification of DDT DDT in fish-eating birds (ospreys) 25 ppm DDT in large fish (needle fish) 2 ppm DDT in small fish (minnows) 0.5 ppm DDT in zooplankton 0.04 ppm DDT in water 0.000003 ppm, or 3 ppt Fig. 9-16, p. 197
Litter Kills Seals Fig. 9-19, p. 200
Extinction • background extinction rate -naturally occurring extinctions - 99 % of all species are now extinct • local extinction extinction of a population but not an entire species • species extinction - disappearance of an entire species - criteria for claiming this? • mass extinction 5 major episodes of extinction in Earth’s past
Extinction Crisis Question • the species-area relationship lose 50% of a habitat, lose 15% of the biodiversity found there • fragmentation and edge effect carving up a habitat into several smaller pieces increases edge habitat, decreases interior habitat and results in a loss of biodiversity • interior species, edge species
Highway Fragmentation Cleared plots for grazing Cleared plots for agriculture Fig. 8-10b, p. 161
Case Study: Amazonia • satellite images are used to measure species loss – How? • deforestation rate is slower than originally thought • however, the pattern of deforestation (fragmentation) may be causing a faster loss of species • primary (old growth) vs. secondary forests (less biodiversity)
Strategies for Protecting Biodiversity • laws and treaties - CITES Convention on International Trade of Endangered Species - MMPA Marine Mammal Protection Act - ESA Endangered Species Act endangered, threatened, special concern • captive breeding, zoos, game parks, cloning
Protecting Marine Biodiversity • why do we use preservation techniques with some species (whales) and conservation techniques with other species (fish)? • part of protecting biodiversity involves measuring populations and migratory patterns – how is that done with whales?
Case Study: Whale Preservation • conservation vs. preservation • commercial whaling • IWC 1986 commercial whaling ban • scientific whaling • subsistence whaling
Study of Whales • fluke prints • satellite tags • captivity