Download
1 / 55
550 likes | 674 Views
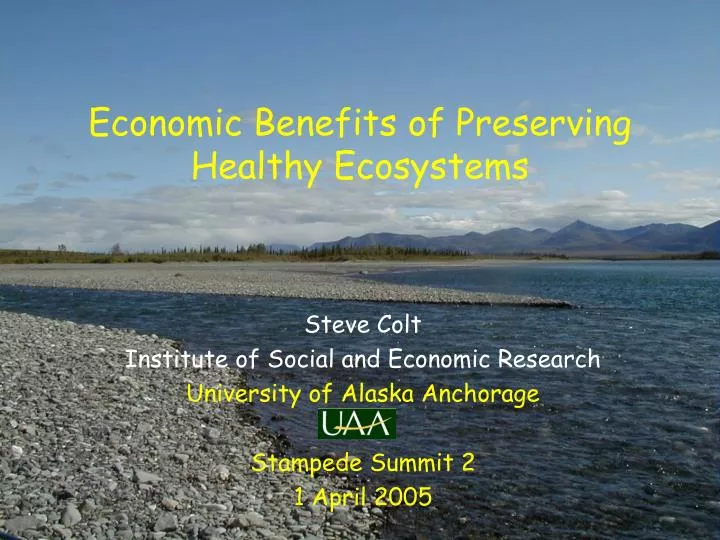
Economic Benefits of Preserving Healthy Ecosystems. Steve Colt Institute of Social and Economic Research University of Alaska Anchorage Stampede Summit 2 1 April 2005. Preview:. What on Earth is Value? Price is not a four-letter word The great divide…. Between price and cost

E N D
Economic Benefits of Preserving Healthy Ecosystems Steve Colt Institute of Social and Economic Research University of Alaska Anchorage Stampede Summit 2 1 April 2005
Preview: • What on Earth is Value? • Price is not a four-letter word • The great divide…. • Between price and cost • Public lands are the answer— • But what was the question? • Wild values: measuring ecosystem services • Sleeping with porcupines • Using the numbers
What on Earth is “Value” ? • Value is subjective • “There is no accounting for taste” • Value is determined partly by: • Circumstances (water in the desert) • Skills and interests (piano, to Beethoven) • Income • Markets reveal value • Economists try to measure value
Price: Value in the Marketplace • Prices are determined by the interaction of buyers and sellers • Buyers compare Their Subjective Value to “the price” • Sellers compare their incremental cost to “the price”
Juan values the good more than Tupak (we don’t know why!) price quantity Forest buys but Siggy does not…..
Abe has a lower production cost than Cecil (we don’t know why!) price quantity Dee produces but Efrin does not
“the price” is determined by the “Twin Scissors” of buyers and sellers
Price is not a four-letter word! • When markets work: • Price = Cost • Value exceeds cost to everyone who decides to buy • That’s good for society – we produce as much, but not more, than people want. (xmas comparison) • Price signals what must be given up to get something
How Markets Work for Conservation: • Prices send signals • High price encourages conservation • High price encourages substitution • High price encourages innovation • What happened to the impending “copper crisis”?
Example: Market for Carbon Emissions • EU Market for Carbon Dioxide emission rights opened January 2005 • The market price of one ton of CO2 is…… • 10 Euro = $14 • This equates to 14 cents per gallon of fuel. • Is this really going to wreck the economy?
The Great Divide – between price and cost • When I drove to Denali today, I emitted 200 kg of carbon dioxide into the atmosphere. • Who bears this cost? • Everyone! • This is a negative spillover or a “negative externality” • The cost of driving (to society!) exceeds the price of driving (to me!)
Your examples, please: • Glitter Gulch – each new development gets all the benefits and spreads the cost of sprawl among all others. • Dog poop – why pick up my dog’s when I am headed “down the trail”?
When markets fail: • Social cost (of climate change) (of congestion) exceeds private cost to the driver • Market for driving generates too much driving • There is no market for carbon emissions! • Private benefit of overfishing exceeds private cost, but total benefit is far less than total cost
The Tragedy of the Commons “The pursuit of freedom in a Commons brings ruin to all” (Garrett Hardin) Big negative externality – like depletion of a fishery
Public Lands are the Answer – but what was the question? Why have collective ownership of healthy ecosystems? • (Think about this for a few moments)
Why Collective Ownership? • Healthy ecosystems provide “ecosystem services” • Clean air, Clean water, Climate • Recreation, hunting, fishing • My consumption does not reduce your consumption (within limits) • It is hard to exclude people from consuming, so private owners cannot charge …(Scenic views!) • The services are often global-scale
Types of Global Ecosystem Services • Biodiversity • Climate • Air • Open ocean fish stocks • Scientific laboratory • These are all direct USE values for both current and future generations
In addition,Existence Value: • I value the knowledge that Blue Whales exist • American households valued the knowledge that Prince William Sound would not suffer another spill at: $31 per household (median) = $2.8 billion total (for U.S.) • You can’t sell existence value! • Only a few will privately produce it
Hence, • Ecosystem services are often not bought and sold in private markets • Environmental goods and services must often be provided through collective social processes (politics!) • We use Politics to translate individual preferences into collective action
Wild Values: Measuring the value of ecosystem services • “The issue of valuation is inseparable from the choices and decisions we have to make about ecological systems” • (Costanza et al 1997) (Remember – value is subjective)
What are we Measuring? • Use Values • Fishing, hunting, recreation • subsistence • ecosystem services (life support) • Non-use Values • Existence, passive use, Includes aesthetics, cultural heritage
How do we do it? • Actual market prices • Replacement cost • Market prices of related goods • Hedonic methods • Observation of behavior • Travel Cost • Ask people • Contingent Valuation
Using Market Prices: ExampleReplacement Cost of Subsistence • 53.5 million lbs harvested • 100+ % of protein needs in rural Alaska • Replacement cost = ?? $4 per lb • Replacement value = 53.5 x 4 = $214 million • Source: ADFG 1998 “Subsistence Update”
Example: Using Market PricesValue of Worldwide Ecosystem Services • Nutrient Cycling $17 trillion / yr • Waste treatment $2.3 trillion / yr • Water regulation & supply $2.9 trillion / yr • Gas regulation $1.3 trillion / yr • Recreation $0.8 trillion /yr • Cultural benefits $3.0 trillion / yr • TOTAL = $33 trillion /yr • Compare to gross world product of $18 trillion / yr
Example: Hedonics • Land Values in Mat Su Valley • Berman (1987) regression equation • Value of parcels declines with distance from Anchorage • Value of parcels declines with number of close neighbors • Value of parcels increases with proximity to public open space
Example: Observed BehaviorValue of Alaska Fish • Example of TC Data: • I live at the fishing site, TC=0, make 6 trips • Brother lives ten miles away, TC = 10, make 3 trips • Cousin lives 20 miles away, TC = 20, makes zero trips • Draw Graph, infer value
Example: Observed BehaviorValue of Alaska Big Game • ADF&G used survey data to estimate TC models for hunting trips • Net values estimated by species and by resident / nonresident status • Total net value of hunted species in year 2000 = $23.5 million
Example: Observed BehaviorValue of Alaska Fish • ISER Results (1993): • People Actually paid: $550 million • People were willing to pay an additional $186 million to fish • $186 million is the net economic value of the sport fishery
Contingent Valuation: ask people • Tentatively endorsed by NOAA Panel • Quality depends on execution • In-person interviews • Yes-no choices • Clear description of scenario • Used by “most federal” and “many state” agencies (Carson 1999) • The ONLY way to measure existence value
Sleeping with Porcupines: Using the Numbers • Problems: • Whose values count? (Willingness to Pay always depends on income) • Reducing complex choices to one dimension ($) • A Trojan Horse? (Weeden 1987) • However, no measurement = a value of zero (?)
Valuation is one, useful, tool “We can find ways to use the sharp-edged techniques of economic valuation without cutting our jugulars” (Bob Weeden 1987)
Playing the Economic Significance Game • 84,000 Alaska jobs depend on healthy ecosystems • $2.6 billion of personal income
Recreation visits to AK National Parks avg annual growth = 7.6% Source: http://www2.nature.nps.gov/stats/
Case Study: Seward Economy(ISER 2001) • Seward wage and salary employment grew at 3.7% per yr between 1980 and 2000, vs. 2.6% for entire State. • Kenai Fjords Park visits:
Denali NP Money Generation (2001): • 218,085 visitor days in 2001 • $22 million total spending • 445 direct average annual jobs • But this is just time IN the park Source: Michigan State U, http://www.prr.msu.edu/mgm2/
Why do People Visit Alaska Why do People Live in Alaska?
MGM Appears Conservative: $23 million Source: ISER ANILCA and Seward economy
Don’t be Bamboozled: • “Total dollars” or “economic activity” numbers should be treated as meaningless until you know what they mean…. • New income? Tax revenue? New payroll? • “New jobs” in one place may mean lost jobs somewhere else. • Ask about displacement!
Economic Value in the Long Run • Ecosystem services – They ain’t making any more of them • Wilderness – it will grow increasingly scarce • Existence value – it will grow with population, income, and education
The Alaska Challenge: • Our healthy ecosystems are increasingly scarce from a national and global perspective • However, they are still viewed as relatively abundant by most Alaskans • “I have plenty of wilderness outside my home in Peters Creek.” • How to address this challenge is up to you!
We’re all in this together. ~The End
Statewide National Parks Money Generation: 2003 Source: Michigan State U, http://www.prr.msu.edu/mgm2/
Using Market Prices: ExampleReplacement Cost of Subsistence • Reality check against expenditures on inputs: • $3.18 million spent in 3 wildlife refuges • 1.76 million lbs harvested • $3.18/1.76 = $1.81 per lb actually spent on commercial inputs • Excludes labor by harvesters • Source: Goldsmith 2000, Colt 2000
Using Market Prices: ExampleReplacement Cost of Worldwide Ecosystem Services • Divide entire world into 16 ecosystem types • Look at 17 ecosystem functions • What does it cost to replicate these functions? • Source: Costanza et al 1997
Example: Hedonics • Idea: property values reflect a “bundle of attributes” – safe streets, good schools, nice neighbors, environmental quality, • Hence, • Variations in property values can be tied to variations in environmental quality
Example: Observed BehaviorValue of Alaska Fish (Based on ISER sport fishing study, 1993 data) • Travel Cost Method (TC) • People incur a travel cost to fish • Those facing higher travel cost make fewer trips to a given site • Use this relationship between number of trips and (travel) cost per trip to estimate net economic value of activity
Example: Observed BehaviorValue of Alaska Fish • Draw a graph:
Example: Observed BehaviorValue of Alaska Fish • Assume all three people have similar preferences • Compute net economic value • Me: between 30 and 60 • Brother: between 0 and 15 • Cousin: zero • TOTAL: between 30 and 75
Example: Observed BehaviorValue of Alaska Fish • ISER Methodology: • Telephone and mail surveys of more than 5,000 residents and nonresidents • Construction of travel costs to multiple sites • Nested multinomial logit models relate fishing behavior to many variables including travel cost • Net economic value computed from models
Net Economic Value of Alaska Big Game(McCollum & Miller 1994, Colt 2000)