Download
1 / 12
120 likes | 479 Views
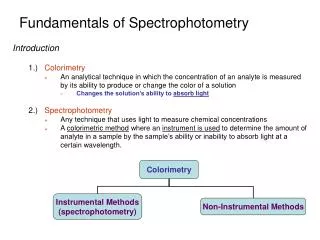
Spectrophotometry. Dr Ron Epping LQB381 Unit Coordinator 1991 - 2012. Spectrophotometry. Extraction/treatment dilutions, etc. Assay. ABSORBANCE READING C o l o u r. TEST SAMPLE clarified. ORIGINAL SAMPLE urine, plasma, etc. There are THREE ways to use spectrophotometry

E N D
Spectrophotometry Dr Ron EppingLQB381 Unit Coordinator 1991 - 2012
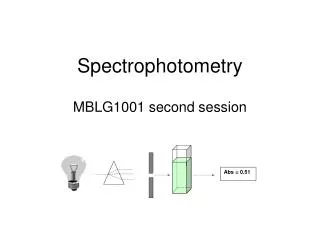
Spectrophotometry Extraction/treatment dilutions, etc. Assay ABSORBANCE READING Colour TEST SAMPLE clarified ORIGINAL SAMPLE urine, plasma, etc There are THREE ways to use spectrophotometry Please familiarise yourself with the different approaches and learn to recognise the difference in your practical classes
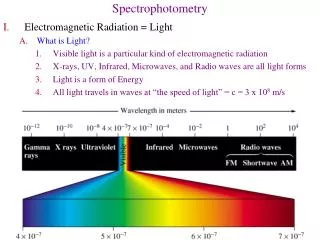
Spectrophotometry Assay ABSORBANCE READING Colour TEST SAMPLE • Using the MOLAR ABSORPTIVITY COEFFICIENT (E) • PROVIDED YOUR TEST SAMPLE IS PURE… i.e. no other molecules in the TEST SAMPLE or buffer absorb light at the wavelength used in the assay • The molar concentration is determined using the Lambert/Beer Law: • A = E litrexlcmx C mol • mol.cm litre
Spectrophotometry Extraction/treatment dilutions, etc. Assay ABSORBANCE READING Colour TEST SAMPLE clarified ORIGINAL SAMPLE urine, plasma, etc ABSORBANCE READING KNOWN STANDARD • 2. Comparison to a single KNOWN STANDARD • COMMON IN CLINICAL ANALYSIS • Provided that the UNKNOWN (ORIGINAL SAMPLE) is treatedin EXACTLY the same manner as the KNOWN (STANDARD) sample throughout the entire procedure (including extractions)… • the ratio of absorbances at the end of the assay is directly proportional to their initial concentrations ! • EASY ! Dilution factors are NOT required !
Spectrophotometry Extraction/treatment dilutions, etc. 3. Using a SERIES of Standards(a “STANDARD CURVE”) • COMMON IN RESEARCH • A series of standards with known amounts or concentrations is prepared from a stock solution. • The standards and TEST SAMPLE are assayed at the same time. • Absorbances are plotted as a standard curve and the amount of material in the TEST SAMPLE is read from the standard curve. • DILUTION FACTORS may be required to calculate the concentration in the ORIGINAL SAMPLE if some extraction/dilution has taken place. Assay ABSORBANCE READING Colour TEST SAMPLE clarified ORIGINAL SAMPLE urine, plasma, etc STD A STD B STD C ABSORBANCE READINGS
LINES/CURVES of BEST FIT 1.6 1.4 1.2 1 0.8 absorabce @ 595nm correct 0.6 0.4 0.2 0 0 20 40 60 80 100 120 ug of protein
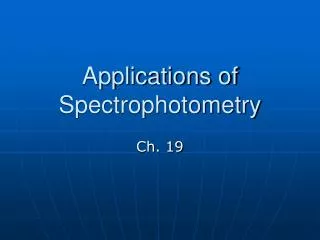
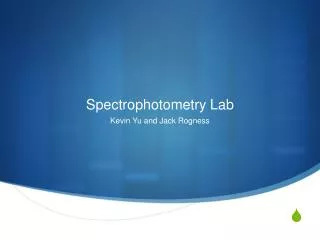
LINES/CURVES of BEST FIT There is an obvious linearity in this data. In this case, LINEAR regression is appropriate 1.6 1.4 1.2 1 0.8 absorabce @ 595nm 0.6 0.4 0.2 0 0 20 40 60 80 100 120 ug of protein
1.6 1.4 1.2 1 0.8 absorabce @ 595nm 0.6 0.4 0.2 0 0 20 40 60 80 100 120 ug of protein LINES/CURVES of BEST FIT There is an obvious linearity in this data. In this case, LINEAR regression is appropriate
Graphing Results • When graphing results: • Use a convenient scale – you do not have to fill the sheet of paper • The line/smooth curve should go through as many points as possible • STANDARD POINTS ONLY should be plotted, and they should be easy to see • The line does not have to go through zero - it depends upon what you used to zero the spectrophotometer • The figure should have a descriptive title, labeled axes and (UNITS) • When reading values from graphs, DONT DRAW EXRA LINES or plot test readings A Plot of absorbance vs Glucose Fig 1. Glucose Standard Curve Absorbance at 420 nm Absorbance Glucose Amount glucose (mmoles) X Xcorrect