Download
1 / 28
280 likes | 421 Views
POPULATION EXPLOSION AND FRESHWATER CRISES. Dr. Mohammed Salim Akhter. Nov 21 st & 22 nd , 2011. Critical Areas. Population Growth Fresh Water Supplies . Food production. Part 1: Population. Currently the world’s population is 6.7 billion. Rate of growth is roughly 75 million per year.

E N D
POPULATION EXPLOSION AND FRESHWATER CRISES Dr. Mohammed Salim Akhter. Nov 21st & 22nd, 2011.
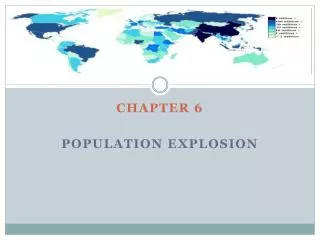
Critical Areas • Population Growth • Fresh Water Supplies. • Food production.
Part 1: Population • Currently the world’s population is 6.7 billion. • Rate of growth is roughly 75 million per year. • On oct,21 (2011) it reached to 7 billion mark. • At this rate it is expected to reach 9.5 billion by 2050. Fig 1: Shows global population growth curve.
Distribution • China and India have a population greater than 1 billion, together possessing more than a third of the world’s population! Fig 2: Shows Distribution of population.
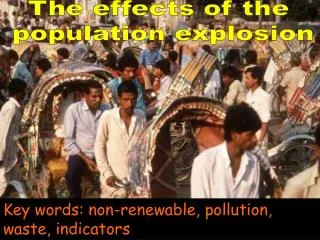
Urban Explosion • In the last 60 years 2 billion people moved to cities. • The World’s population has tripled over the last 60 years. • In Shanghai, 3000 sky-scrapers came up in the last 20 years and 100 more are under construction. • Today, 50% of people live in cities.
Population Growth in Pakistan Fig 3: Shows population increase in Pakistan.
Part 2: Freshwater Crisis • Only 3% of the world’s water is fresh; all the rest is salty. • One Million Acre Foot is the volume of water that covers one million acres of land to a depth of 1 foot. • Each person needs about 1 Million Acre Foot of water each year. • This is equivalent to about 8,000 barrels or 1,000 cubic meters of water!
Fresh Water Sources • Only 0.5% of fresh water is available. • The majority is in aquifers, natural lakes and in the form of rainfall.
Rainfall • 110,000 cubic kilometers of precipitation falls onto the earth’s land surface every year. • This is 10 times the volume of Lake Superior. • Enough to easily fulfill requirements of everyone. • But much of it cannot be captured! • More than half evaporates • A third ends up in oceans • Only 1.5% is used by people!
Ground Water • In the last 50 years 21 million wells have dried up. • The level of water in oceans is going down 1 meter per year. • Accessing ground water requires digging deeper. • While levels are falling we are extracting more water! • Total estimated ground water in Pakistan is 50-60 MAF. We are already very close to this limit!
Desert Crops • 25,000 years ago, water collected under deserts. This water is non-renewable but is being used to grow vegetables and grain in KSA, Libya and Africa. • Desert crops are inherently inefficient but feasible if ground-water is managed by treated, cyclic use and losses are minimized. • Cost-effective lining/layering materials (e.g., HDPE/plastic sheets) can greatly reduce water losses in tanks, ponds, etc. • Similarly, renewable energy powered (solar and wind) pumps can be used to transport water via drip/sprinklers.
Shortages • Today 1 out of 6 people face inadequate access to safe freshwater. • By 2025 more than half of the countries across the globe will face shortages according to the UN. • By 2050 up to 75% of the world could face shortages. • In Western India 30% of wells have dried up and been abandoned. • Residents of Las Vegas are one of the largest consumers of water in the world. Las Vegas was built in the desert! • Water shortage could effect 2 billion people by 2025.
Freshwater Availability • Global • 1950 – 16,800 cubic meters per annum • 2000 – 6,800 cubic meters per annum • Reduction of 60% in 50 years! • Pakistan • 1950 – 5,300 cubic meters per annum • 2000 – 1,200 cubic meters per annum • Reduction of 77% in 50 years! • Critical limit: 1,000 cubic meters per person per annum
Consumption • Not only does demand rise with population size and growth rate, it also tends to go up with income level. • The rich also require wastewater treatment and intensive farm irrigation. • The world's largest consumer of water is an American. Next in line is a European.
Global Water Shortage • Regions in Central Asia and North America face “physical” scarcity i.e., demand exceeds supply. • Regions in Central Africa, South & South-East Asia face “economic” scarcity i.e., lack of training, bad governments or weak finances limit access, even though sufficient supplies are available.
Water Hot Spots • Ogallala Aquifer: 95% of the US fresh water supply is underground. The Ogallala aquifer was formed over millions of years and supplies 1/3rd of all US irrigation water. According to expectations it might last for only 60 more years. • Tigris & Euphrates: Drainage and irrigation schemes in Iraq have led to the loss of an estimated 90% of one of the world’s most significant wetlands. • China: In the north all 3 rivers are severely polluted while the Yellow River which supplies water to China’s most critical farming region runs dry 200 days every year. • The mighty river Jordan is now a trickle across the planet. • One in ten major rivers no longer flow into the sea for several months of a year.
Solutions for Shortages • Limit waste • Build recycling and reclamation systems • Improve water-delivery systems to reduce losses. • Channel water for crop fields to underground storage in the non-growing season. • Extensive use of drip-irrigation systems that allow water to seep in slowly. • New crop varieties that can tolerate low water levels. • New desalination techniques such as membrane reverse-osmosis systems.
Protect Natural Water Cycle and Resource Base • Ensure that the natural water cycle is maintained • Protect all water bodies from pollutants including rivers, lakes and flood-plains. • For groundwater aquifers use artificial recharge in fresh zones. • Also minimize and drain effluent in saline areas.
National Way Forward • National Water Policy • Provincial Water Visions in accordance with the Indus Water Treaty and later accords • Creation of a Water Resources Development and Management Think Tank with experts from the Planning Commission, HEC, Universities, PEC, PSAE etc. • Control quality of water resources with house-hold waste management, controls on commercial and domestic use and upkeep and maintenance of infrastructure. • Control demand side with appropriate pricing, public conservation drives and provision of water-conserving house-hold appliances such as dual-flush toilets that allow for either a full flush or a half flush.
Part 3: Food Production • Power of coal and oil (Black Gold) has dramatically changed the world. • Much of the World’s grain is converted into bio-feed and fed to raise livestock, thus used primarily to produce meat. • Toxic pesticides used to improve crop yields penetrate the heart of every mother’s cells. • Fertilizer, another Petrochemical byproduct which is generously used during harvesting, is producing its own harmful effects.
Food Production • Varieties of grain developed by farmers over thousands of years have been wiped out of the planet by new fast-growing crops. • The more a country is considered developed, the more meat its inhabitants produce and consume. • Soya bean and protein-rich grains are mainly used to feed cattle not humans.
Food Production • It takes 100 liters of water to produce 1kg of potatoes. • While it takes 4,000 liters of water to produce 1kg of rice. • And it takes 30,000 liters of water to produce 1kg of beef.
Thank You • Dr. Mohammed Salim Akhter. • Former Vice-Chancellor, Dean of Science and Professor. • MRCOG, FRCOG, FRCS, FACOG, FCPS, Phd. • http://www.shadmanhouse.org • msakhter47@yahoo.com