Download
1 / 32
320 likes | 508 Views
Interferometry Basics. Caltech ALMA Community Day Pasadena, March 16, 2011. Andrea Isella Caltech. References. Thompson, A.R., Moran, J.M., & Swensen , G.W. 2004, “ Interferometry and Synthesis in Radio Astronomy” 2nd edition (WILEY-VCH) NRAO Summer School proceedings

E N D
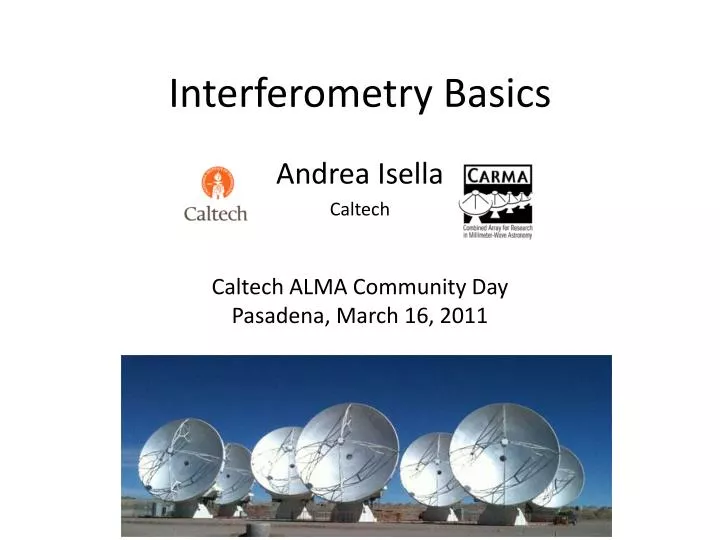
Interferometry Basics Caltech ALMA Community Day Pasadena, March 16, 2011 Andrea Isella Caltech
References • Thompson, A.R., Moran, J.M., & Swensen, G.W. 2004, “Interferometry and Synthesis in Radio Astronomy” 2nd edition (WILEY-VCH) • NRAO Summer School proceedings • http://www.aoc.nrao.edu/events/synthesis/2010/lectures10.html(in particular D.Wilner lecture) • Perley, R.A., Schwab, F.R. & Bridle, A.H., eds. 1989, ASP Conf. Series 6, Synthesis Imaging in Radio Astronomy (San Francisco: ASP) • Chapter 6: Imaging (Sramek & Schwab), Chapter 8: Deconvolution (Cornwell) • IRAM Summer School proceedings • http://www.iram.fr/IRAMFR/IS/archive.html • Guilloteau, S., ed. 2000, “IRAM Millimeter Interferometry Summer School” • Chapter 13: Imaging Principles, Chapter 16: Imaging in Practice (Guilloteau) • J. Pety 2004, 2006, 2008 Imaging and Deconvolution lectures • CARMA Summer School proceedings • http://carma.astro.umd.edu/wiki/index.php/School2010 • CARMA SUMMER school, July 2011, ask J. Carpenter for information Andrea Isella :: ALMA community day :: Caltech, March 16, 2011
From Sky Brightness to Visibility An Interferometer measures the interference pattern produced by two apertures. The interference pattern is directly related to the source brightness. In particular, for small fields of view the complex visibility, V(u,v), is the 2D Fourier transform of the brightness on the sky, T(x,y) y x T(x,y) image plane (van Cittert-Zernike theorem) Fourier space/domain uv plane Image space/domain Andrea Isella :: ALMA community day :: Caltech, March 16, 2011
Visibility and Sky Brightness 1 |V| 0.5 b1 b2 b2 0 b (meters) b1 =/b =/b phase • The visibility is a complex quantity: • - amplitude tells “how much” of a certain frequency component • - phase tells “where” this component is located Andrea Isella :: ALMA community day :: Caltech, March 16, 2011
Visibility and Sky Brightness 1 V 0.5 b1 b3 b2 0 b (meters) b1 • The visibility is a complex quantity: • - amplitude tells “how much” of a certain frequency component • - phase tells “where” this component is located Andrea Isella :: ALMA community day :: Caltech, March 16, 2011
2D Fourier Transform Pairs T(x,y) • |V(u,v)| Function Constant Gaussian Gaussian Andrea Isella :: ALMA community day :: Caltech, March 16, 2011
2D Fourier Transform Pairs T(x,y) • |V(u,v)| elliptical Gaussian elliptical Gaussian Disk Bessel sharp edges result in many high spatial frequencies Andrea Isella :: ALMA community day :: Caltech, March 16, 2011
Need for high angular resolution CARMA A-array configuration D=50 m Herschel CCAT CARMA Spitzer 10-3 10-2 10-1 100 101 102 SMA PdBI EVLA θ (‘’) 2 Km ALMA HST 1.2 miles Keck VLTI θ = 0.15’’ at 1.3 mm 10-1 100 101 102 103 104 λ (μm) Andrea Isella :: ALMA community day :: Caltech, March 16, 2011
Aperture Synthesis V(u,v) can be measured on a discrete number of points. A good image quality requires a good coverage of the uv plane. We can use the earth rotation to increase the uv coverage Andrea Isella :: ALMA community day :: Caltech, March 16, 2011
Synthesized beam Discrete sampling: The weighting function W(u,v)is 0 where V is not sampled T’(x,y) is FT of the product of W and V, which is the convolution of the FT of V and W: B(x,y) is the synthesized beam, analogous of the point-spread function in an optical telescope. Andrea Isella :: ALMA community day :: Caltech, March 16, 2011
Effects of a sparse uv coverage Synthesized Beam (i.e.,PSF) for 2 Antennas Andrea Isella :: ALMA community day :: Caltech, March 16, 2011
Effects of a sparse uv coverage 3 Antennas Andrea Isella :: ALMA community day :: Caltech, March 16, 2011
Effects of a sparse uv coverage 4 Antennas Andrea Isella :: ALMA community day :: Caltech, March 16, 2011
Effects of a sparse uv coverage 5 Antennas Andrea Isella :: ALMA community day :: Caltech, March 16, 2011
Effects of a sparse uv coverage 6 Antennas Andrea Isella :: ALMA community day :: Caltech, March 16, 2011
Effects of a sparse uv coverage 7 Antennas Andrea Isella :: ALMA community day :: Caltech, March 16, 2011
Effects of a sparse uv coverage 8 Antennas Andrea Isella :: ALMA community day :: Caltech, March 16, 2011
Effects of a sparse uv coverage 8 Antennas x 6 Samples Andrea Isella :: ALMA community day :: Caltech, March 16, 2011
Effects of a sparse uv coverage 8 Antennas x 30 Samples Andrea Isella :: ALMA community day :: Caltech, March 16, 2011
Effects of a sparse uv coverage 8 Antennas x 60 Samples Andrea Isella :: ALMA community day :: Caltech, March 16, 2011
Effects of a sparse uv coverage 8 Antennas x 120 Samples Andrea Isella :: ALMA community day :: Caltech, March 16, 2011
Effects of a sparse uv coverage 8 Antennas x 240 Samples Andrea Isella :: ALMA community day :: Caltech, March 16, 2011
Effects of a sparse uv coverage 8 Antennas x 480 Samples The synthesized beam approaches a 2D gaussian function and can be described in terms of its Full Width at Half Maximum (FWHM) and Position Angle (PA) Andrea Isella :: ALMA community day :: Caltech, March 16, 2011
Characteristic angular scales An interferometer has at least THREE important characteristic angular scales: - angular resolution: ~ λ/Dmax, where Dmax is the maximum separation between the apertures. - shortest spacing problem: the source is resolved if θ>λ/Dmin, where Dminis the minimum separation between apertures. An interferometer is sensitive to a range of angular sizes,λ/Dmax- λ/Dmin and since Dmin> Aperture diameter, an interferometer is not sensitive to the large angular scales and cannot recover the total flux of resolved sources (you need a single dish, e.g., CSO, APEX, IRAM 30 m, ALMA total power array, CCAT). 2. Field of view of the single aperture ~ λ/D, where D is the diameter of the telescope. Source more extended than the field of view can be observed using multiple pointing centers in a mosaic. Andrea Isella :: ALMA community day :: Caltech, March 16, 2011
Primary beam and Field of View • A telescope does not have uniform response across the entire sky • - main lobe approximately Gaussian, fwhm ~1.2/D = “primary beam” • limited field of view ~ /D Andrea Isella :: ALMA community day :: Caltech, March 16, 2011
Characteristic angular scales during • ALMA early science Dmax = 250 m, Dmin = 20 m, D = 12 m • How complex is the source? Is good (u,v) coverage needed? This may set additional constraints on the integration time if the source has a complex morphology. • How large is the source? If it is comparable to the primary beam (l/D), you should mosaic several fields (NOTE that during early science ALMA will have limited mosaicing capabilities) Andrea Isella :: ALMA community day :: Caltech, March 16, 2011
From visibilities to images • uv plane analysis • best for “simple” sources, e.g. point sources, disks • image plane analysis • Fourier transform V(u,v) samples to image plane, get T’(x,y) • but difficult to do science on dirty image • deconvolveb(x,y) from T’(x,y) to determine (model of) T(x,y) visibilities dirty image sky brightness deconvolve Fourier transform Andrea Isella :: ALMA community day :: Caltech, March 16, 2011
Weighting function Measured flux: Synthesized beam: You can change the angular resolution and sensitivity of the final image by changing the weighting function W(u,v) Andrea Isella :: ALMA community day :: Caltech, March 16, 2011
Weighting function • “Natural” weighting: W(u,v) = 1/σ2(u,v), where σ2(u,v) is the noise variance of the (u,v) sample:Advantage: gives the lowest noise in the final image, highlight extended structures.Disadvantage: generally gives more weights to the short baseline (where there are more measurements of V) degrading the resolution • “Uniform” weighting: W(u,v) is inversely proportional to the local density of (u,v) points. It generally gives more weights to the long baseline therefore leading to higher angular resolution. • Advantage: better resolution and lower sidelobes • Disadvantage: higher noise in the final map • “Robust” (Briggs) weighting: W(u,v) depends on a given threshold value S, so that a large S gives natural weighting and a small S gives uniform weighting. • Advantage: continuous variation of the angular resolution. Andrea Isella :: ALMA community day :: Caltech, March 16, 2011
Weighting function NATURAL WEIGHTING UNIFROM WEIGHTING FWHM beam size = 1.7’’ x 1.2’’ 0.21’’ x 0.19’’ Andrea Isella :: ALMA community day :: Caltech, March 16, 2011
Deconvolution: Dirty Vs Clean image A non complete coverage of the uv plane gives a synthesized beam with a lot of sidelobes, i.e. a ‘dirty’ beam. And since , T’(x,y) is also characterized by sidelobes, i.e., ‘dirty’ image. The deconvolution process consists in giving reasonable values to the visibility in the unmeasured (u,v) areas in order to get a nice gaussian beam without sidelobes. The most successful deconvolution procedure is the algorithm CLEAN (Hogbom 1974). Deconvolution or Cleaning Dirty image Clean image Andrea Isella :: ALMA community day :: Caltech, March 16, 2011
Concluding remarks • Interferometry samples visibilities that are related to a sky brightness image by the Fourier transform • In planning your observations keep in mind these three important scales: λ/Dmax ,λ/Dmin,λ/D • remember… there are usually an infinite number of images compatible with the sampled visibilities. Play around with the weighting functions while using the ALMA simulator • Deconvolution (e.g. cleaning) try to correct for the incomplete sampling of the uv-plane. Play around with ‘clean’ while using the ALMA simulator Andrea Isella :: ALMA community day :: Caltech, March 16, 2011