Download
1 / 27
270 likes | 449 Views
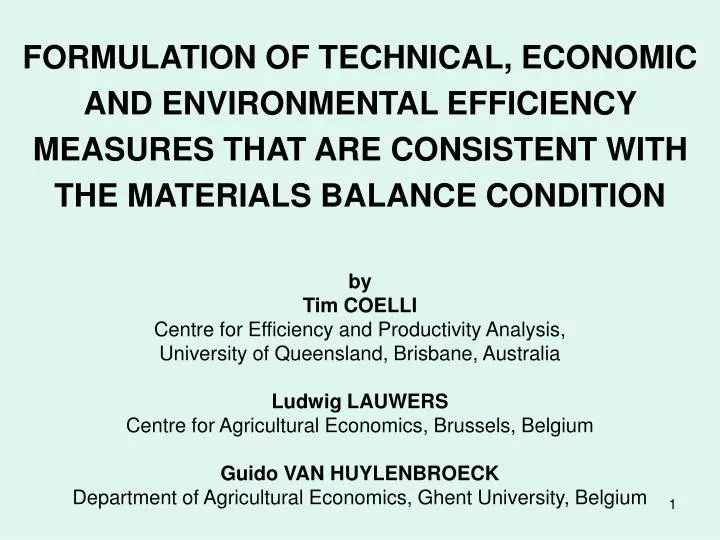
FORMULATION OF TECHNICAL, ECONOMIC AND ENVIRONMENTAL EFFICIENCY MEASURES THAT ARE CONSISTENT WITH THE MATERIALS BALANCE CONDITION. by Tim COELLI Centre for Efficiency and Productivity Analysis, University of Queensland, Brisbane, Australia Ludwig LAUWERS

E N D
FORMULATION OF TECHNICAL, ECONOMIC AND ENVIRONMENTAL EFFICIENCY MEASURES THAT ARE CONSISTENT WITH THE MATERIALS BALANCE CONDITION by Tim COELLI Centre for Efficiency and Productivity Analysis, University of Queensland, Brisbane, Australia Ludwig LAUWERS Centre for Agricultural Economics, Brussels, Belgium Guido VAN HUYLENBROECK Department of Agricultural Economics, Ghent University, Belgium
Outline • Introduction • Literature review and critique • Proposed environmental efficiency measures • Implementation using DEA • Application to Belgian pig farms • Conclusions
Introduction • Traditional efficiency measurement methods do not include pollution • Some authors proposed methods that include a pollution variable as an extra variable in the production model – as a “bad output” or an input • We argue that many of these latter methods are inconsistent with the materials balance condition – which essentially states that “what goes in must come out” • Plus these methods tend to assume that all pollution reduction must be costly
Introduction (continued) • We propose a new method that is consistent with the materials balance condition • The method looks at pollution minimisation in an analogous way to the standard cost minimising model • The method explicitly allows for both cost increasing and cost decreasing pollution reduction
Traditional efficiency analysis • Does not account for environmental damage • Only traditional inputs and outputs are included in the model • E.g., in electric power generation • Inputs = labour, capital, fuel, other • Output = electricity • Air pollution not considered • E.g., on a pig fattening farm • Inputs = labour, capital, feed, piglets, other • Output = pig meat • Nutrient pollution in soils and water not considered
Traditional efficiency measures • Normally we estimate the production technology set ( ) by fitting a production frontier over the data (using DEA or SFA methods) • We then measure the efficiency of each firm as either: • The amount by which it can expand output ( ) using its current inputs ( ) and remain feasible • or, the amount by which it can reduce inputs while still producing the same output
Efficiency measures output frontier ● A input
Efficiency measures including pollution • Färe et al (1989) • Air pollution in paper mills • Included a pollution variable ( ) as a “bad output” in the production model • Weak disposability was imposed on the pollution variable to reflect that its disposal was costly • A hyperbolic efficiency measure was used which sought to simultaneously expand outputs and reduce inputs and bad outputs
Efficiency measures including pollution (2) • Färe et al (1996) • Air pollution in electricity generation • Included a pollution variable as a “bad output” in the production model • Weak disposability was imposed on the pollution variable to reflect that its disposal was costly • Productive efficiency measure sought to reduce inputs • Environmental efficiency measure sought to reduce pollution
Efficiency measures including pollution (3) • Reinhard et al (2000) • Nitrogen pollution on intensive dairy farms • Included a pollution variable as an input in the production model • Productive efficiency measures sought to reduce all inputs or expand outputs • Environmental efficiency measure sought to reduce pollution
Are these past methods consistent with the materials balance condition? • Materials balance condition: aandbare (K1 and M1) vectors of known non-negative constants • Consider first the Reinhard et al (2000) environmental efficiency measure • Can we reduce pollution without changing inputs or outputs? - the answer is no – it will violate the materials balance condition • The only solution to is =1
Consistency? • In addition – if we apply the Färe et al (1989) efficiency measure to the MB condition we obtain or so the only solution is =1 again • This applies to the other models as well…
Proposed efficiency measures • Do not include the pollution variable into the model • Treat it in an analogous manner to the cost efficiency model • We first review the cost efficiency case • Then we introduce the environmental efficiency case
Cost efficiency • Cost minimisation • Cost efficiency • Technical efficiency • Allocative efficiency • Note
Environmental efficiency • For a fixed output level, minimisation of the surplus means minimisation of the nutrient content of the inputs • Surplus minimisation • Environmental efficiency • Technical efficiency is the same as before • Environmental allocative efficiency • Note
Generalisations • More than one pollutant • Identify optimal point for each, or • Specify weights and identify a single “environmental” optimal point • An “overall” optimal point • Include measures of the social costs of pollution • Pollution abatement activities • Involves the explicit use of extra inputs • Include a “pollution abatement” (good) output variable
Data envelopment analysis implementation Technical efficiency Environmental efficiency
Application to Belgian intensive pig-fattening farms • Nutrient pollution (mostly phosphorous) from manure causes eutrophication and acidification of soils and water in Flanders • Output = pig meat • Inputs = feed, piglets, labour, capital and other • Preliminary regression analysis: • Latter 3 inputs are statistically insignificant (and minor in terms of costs) • Constant returns to scale (CRS) • Hence simple DEA model with two inputs and CRS
Reduction in pollution? • Total phosphorous in inputs on Flanders pig fattening farms is 38.1 million kg P2O5 per year • In pig meat output it is 13.6 million kg P2O5 • Thus the surplus is 24.5 million kg P2O5 • Potential reduction is 15.7% of 38.1 = 6.0 million kg P2O5 • This is approximately ¼ of current surplus
iso-cost line isoquant iso-nutrient line DEA for pig farms
Implied shadow cost? • The two optimal points differ • in costs by 4.6% and • in nutrient surplus by 5.3% • Implied cost of phosphorous reduction is 27 Euros per kg P2O5 • Current manure treatment cost is 6 Euros per kg • So aim for cost min point (in this case)
Conclusions • New environmental efficiency measure • Consistent with materials balance condition • Can be decomposed into technical and allocative components • Emphasizes that pollution reduction need not be always costly • Application to Belgian pig farms • One quarter of phosphorous surplus can be reduced before abatement activities considered