Download
1 / 1
10 likes | 113 Views
Supplemental Fig. 1. a. pCrGFP. rbcS2 P. β 2-Tub P. CrGFP. psaD T. rbcS2 T. aph7 ”. Intron 1 rbcS2. b. UVM11. 1 2 3 4 5 6 7 8 9 10 11 12. c. UVM11. 1 2 3 4 5 7 8 9 10 11 12. CrGFP. d. UVM11.

E N D
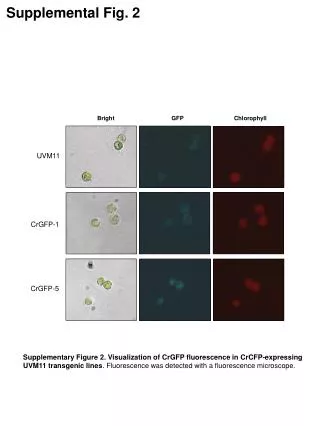
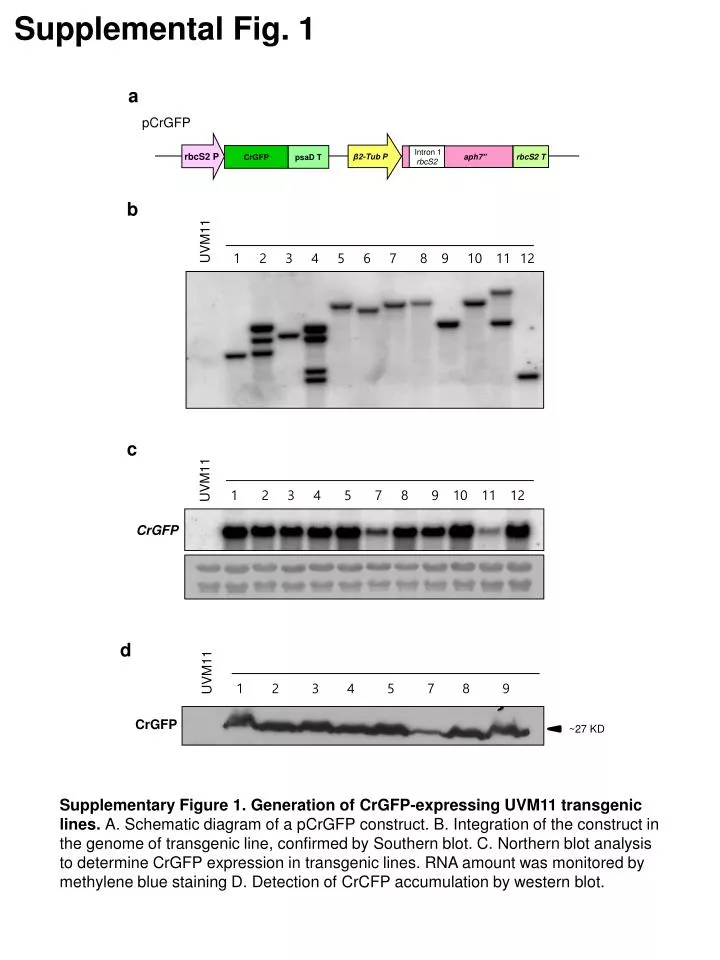
Supplemental Fig. 1 a pCrGFP rbcS2 P β2-Tub P CrGFP psaD T rbcS2 T aph7” Intron 1 rbcS2 b UVM11 1 2 3 4 5 6 7 8 9 10 11 12 c UVM11 1 2 3 4 5 7 8 9 10 11 12 CrGFP d UVM11 1 2 3 4 5 7 8 9 CrGFP ~27 KD Supplementary Figure 1. Generation of CrGFP-expressing UVM11 transgenic lines. A. Schematic diagram of a pCrGFP construct. B. Integration of the construct in the genome of transgenic line, confirmed by Southern blot. C. Northern blot analysis to determine CrGFP expression in transgenic lines. RNA amount was monitored by methylene blue staining D. Detection of CrCFP accumulation by western blot.