Download
1 / 65
650 likes | 665 Views
Learn about the methods and applications of GIS data analysis in international agriculture and weather forecasting. Discover how GIS technology allows for efficient data integration, visualization, and analysis, saving time and effort. Explore case studies and examples of using GIS for crop analysis, soil moisture monitoring, drought detection, and more.

E N D
USDA-WAOB GIS; International Applications, Uses, and Methods Eric Luebehusen Meteorologist November 17, 2010
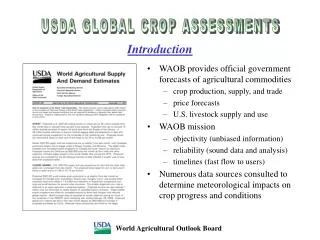
USDA Meteorologists rely heavily on GIS data to perform a variety of analyses for international AOR
This talk will concentrate on methods and applications using data from NOAA…
The flexibility of GIS allows for numerous data sources and global/regional views in one project, saving time and effort… and also makes “backing up” other analysts much easier
… but country- or district-level crop data and/or shapefiles; Here, winter wheat from the Russian Agromet Office
Within the project are macros written to extract Wx Data; This data is provided by CPC and stored in Oracle at USDA
Flexibility is key; User-defined start and stop dates as well as data types
Also, the time period need only be run once, with a suite of parameters now available for analysis
Sfc analysis is created using “Natural Neighbor,” with bad station data omitted in a Definition Query prior to running the Spatial Analyst
The output closely matches the CPC weekly maps, albeit a different color scheme
CPC-supplied CMORPH geotiffs are also part of the daily downloads
The data is downloaded using WGET, but Windows software serves as a backup (ie, Core FTP)
DOS batch commands not only allow for date-coded archives, but for a duplicate renamed “Current.tif” which will dynamically update on open
CPC-supplied RFE regional geotiffs are downloaded and archived; these too are summed using a macro
The net result is a third source of pcp data for some int’l areas
CPC supplies NOAH snow depth, which coupled with temperature data can provide a quick heads up with respect to winterkill
CPC-supplies NOAH soil moisture for top 2 model layers; Color cutoffs/criteria developed by B Morris (via soil moisture course work)
Here, the haves and have-nots in Australia stand out within the Wheat Areas (overlay developed by H Shannon)
On a weekly basis, maps are produced that denote soil moisture change year-to-year and month-to-month, in percent
NESDIS is supplying VHI geotiff data on a weekly basis, which has been very useful for drought detection and crop-stage departures.
Year-to-year changes (in percent) are created for the VHI as well
Global MODIS Hotspot data are downloaded daily to detect wildfires and seasonal burns
CPC-Supplied GFS (00z) forecast data are used in the weekly and monthly (Lockup) presentations given to USDA Economists
Needless to say, interests at the World Board are not solely international…
The Drought Monitor: One development at USDA has been to use GIS for more than simply editing USDM Dx lines/Impacts, but for data assessment
An “editor” is loaded with data, but points to the same shapefiles in the primary USDM project
An “editor” is loaded with data, but points to the same shapefiles in the primary USDM project
CPC-generated SPI data have been a boon to the USDM authoring process at USDA
Data are downloaded (WGET), renamed (“Current.tif”), and archived
This allows the author to easily zoom in for editing, and no need to worry about downloading data or “messing up” the main USDM project
CPC 3-month SPI This allows the author to easily zoom in for editing, and no need to worry about downloading data or “messing up” the main USDM project
CPC Soil Moisture This project has expanded to include not only data from CPC…
EMC NLDAS Soil Moisture … but other sources too, such as NLDAS data from EMC
CPC 30-Day Obs Pcp All of CPC’s precip data in support of the USDM is downloaded and saved…
CPC 90-Day Obs Pcp Makes it very easy to look at different timescales…
CPC 90-Day Pcp Departure … and parameters, including pcp departure
CPC 90-Day PNP … and percent of normal precip.
AHPS 90-Day PNP USDA just started downloaded the suite of precip products from AHPS, which provide more detail
AHPS 90-Day PNP The data helped resolve some local issues in Florida during my past USDM shift…
AHPS 90-Day PNP CPC 90-Day PNP With some discrepancies noted with the 1st-order CPC data
AHPS 90-Day PNP CPC 90-Day PNP Local reports supported the more dire AHPS depiction
AHPS 7-Day Pcp Also downloaded are the7- and 14-day AHPS total Pcp.
The need for special analyses (discussed earlier) and USDM-cutoffs led to the development of a macro that allows more flexibility
AHPS 7-Day Pcp Consequently, we are able to easily create pcp maps that match the USDM’s 12z Tues cutoff (or other special Wx event)
NESDIS VHI The VHI (from F Kogan, et al) is also part of the USDM GIS editor…