Download
1 / 67
710 likes | 845 Views
Explore how material flaws lead to failure, quantify fracture resistance, estimate stress to fracture, and understand effects of loading rate, history, and temperature on failure stress. Learn about fracture mechanisms such as ductile and brittle fractures, stress concentration, fracture toughness, and design considerations using fracture mechanics. Discover principles of fracture mechanics through examples like computer chips, hip implants, and ship structures.

E N D
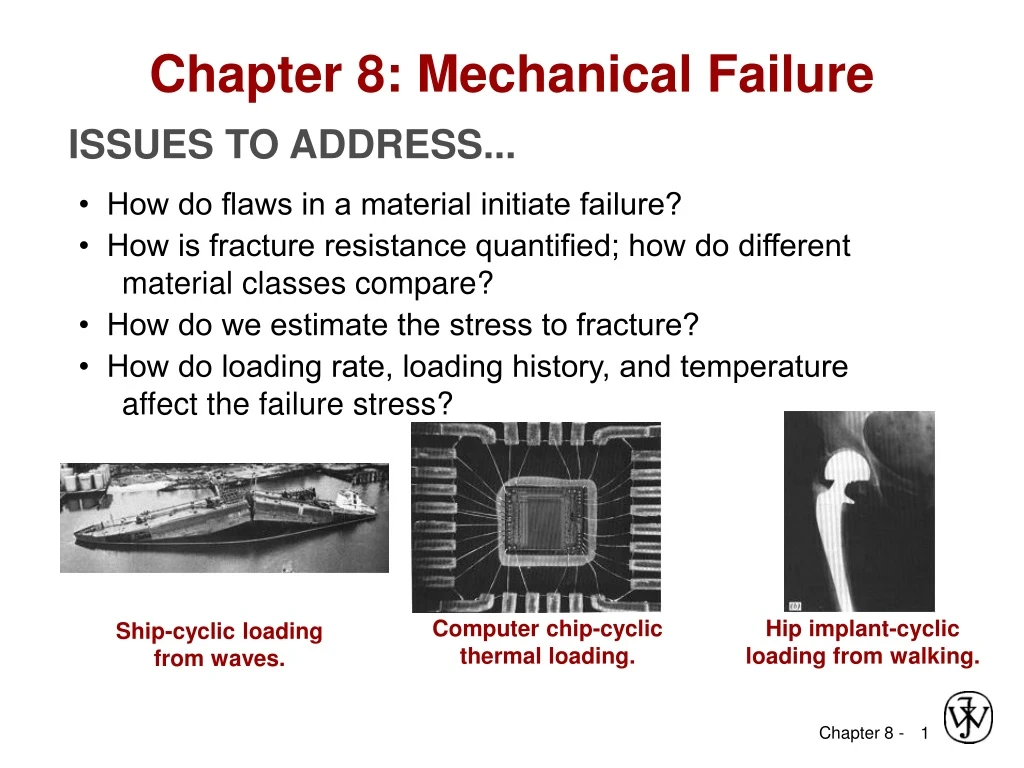
Chapter 8: Mechanical Failure ISSUES TO ADDRESS... • How do flaws in a material initiate failure? • How is fracture resistance quantified; how do different material classes compare? • How do we estimate the stress to fracture? • How do loading rate, loading history, and temperature affect the failure stress? Computer chip-cyclic thermal loading. Hip implant-cyclic loading from walking. Ship-cyclic loading from waves.
Failure mechanisms • Fracture • Fatigue • Creep • Corrosion • Buckling • Melting • Thermal shock • Wear
1. Fracture mechanisms Fractureis the separation of a body into two or more pieces in response to an imposed stress that is static (i.e., constant or slowly changing with time) and at temperatures that are low relative to the melting temperature of the material. The applied stress may be tensile, compressive, shear, or torsional; • Ductile fracture • Occurs with plastic deformation • Brittle fracture • Little or no plastic deformation • Suddenly and catastrophic • Any fracture process involves two steps—crack formation and propagation—in response to an imposed stress
Very Moderately Fracture Brittle Ductile Ductile behavior: %AR or %EL Large Moderate Small Ductile vs Brittle Failure • Classification: Ductility is a function of temperature of the material, the strain rate, and the stress state. May be quantified in term of %AR or %EL • Ductile fracture is usually desirable! Ductile: warning before fracture More strain energy is required Brittle: No warning
Example: Failure of a Pipe • Brittle failure: --many pieces --small deformation • Ductile failure: --one piece --large deformation
Moderately Ductile Failure void growth shearing void necking fracture and linkage at surface nucleation s 50 mm 50 mm • Resulting fracture surfaces (steel) 100 mm particles serve as void nucleation sites. • Evolution to failure:( stages in the cup-cone fracture)
Ductile vs. Brittle Failure cup-and-cone fracture in aluminum brittle fracture in a mild steel Metal alloys are ductile Ceramics are notably brittle Polymers may exhibit both types of fracture.
Brittle fracture takes place without any appreciable deformation, and by rapid crack propagation. Brittle Failure Arrows indicate point at which failure originated
Brittle Fracture Surfaces • Inter-granular (the fracture cracks pass through the grains) • Intra-granular (crack propagation is along grain boundaries) 304 S. Steel (metal) 160mm 316 S. Steel (metal) 4mm Al Oxide (ceramic) Polypropylene (polymer) 3mm 1mm
Principles of fracture mechanics This subject allows quantification of the relationships between material properties, stress level, the presence of crack-producing flaws, and crack propagation mechanisms. • stress concentration • Fracture toughness • Design using fracture mechanics • Impact fracture testing
Stress Concentration Flaws are Stress Concentrators! Results from crack propagation • Griffith Crack where t = radius of curvature so = applied stress=F/A sm = stress at crack tip t Flaws: are called stress raiser
Concentration of Stress at Crack Tip • Stress amplification is not restricted • to these microscopic defects; it may occur at macroscopic internal discontinuities (e.g., voids), at sharp corners, and at notches in large structures. • The effect of a stress raiser is more significant in brittle than in ductile materials. For a ductile material, plastic deformation ensues when the maximum stress exceeds the yield strength. This lead to a more uniform distribution of stress in the vicinity of the stress raiser. Such yielding and stress redistribution do not occur to any appreciable extent around flaws and discontinuities in brittle materials; therefore, essentially the theoretical stress concentration will result.
s o max Stress Conc. Factor, K t = s o w s 2.5 max h r , 2.0 increasing fillet w/h radius 1.5 r/h 1.0 0 0.5 1.0 sharper fillet radius Engineering Fracture Design • Avoid sharp corners! s It is a measure of the degree to which an external stress is amplified at the tip of a crack.
Crack Propagation Cracks propagate due to sharpness of crack tip • A plastic material deforms at the tip, “blunting” the crack. deformed region brittle Energy balance on the crack • Elastic strain energy- • energy stored in material as it is elastically deformed • this energy is released when the crack propagates • creation of new surfaces requires energy plastic
When Does a Crack Propagate? Crack propagates if applied stress is above critical stress sc( it is the stress required for crack propagation in a brittle materials) where • E = modulus of elasticity • s= specific surface energy • a = one half length of internal crack • Kc = sc/s0 For ductile => replace gs by gs + gp where gp is plastic deformation energy i.e., sm>sc orKt> Kc
Design Against Crack Growth • Relationship between critical stress for crack propagation (σc) to crack length (a) - Is fracture toughness, a property that is a measure of a material’s resistance to brittle fracture when a crack is present. Y - is a dimensionless parameter or function that depends on both crack andspecimensizes and geometries, as well as the manner of load application.( Y = 1 – 1.1)
Graphite/ Metals/ Composites/ Ceramics/ Polymers Alloys fibers Semicond 100 1 C-C (|| fibers) Steels 7 0 6 0 Ti alloys 5 0 4 0 Al alloys 3 0 ) Mg alloys 0.5 2 0 2 Al/Al oxide(sf) 4 Y O /ZrO (p) 2 3 2 1 C/C ( fibers) 10 3 Al oxid/SiC(w) (MPa · m 5 Si nitr/SiC(w) Diamond 7 4 Al oxid/ZrO (p) 2 6 Si carbide 6 Glass/SiC(w) 5 PET Al oxide Si nitride 4 PP Ic 3 PVC K 2 PC 1 <100> 6 Glass PS Si crystal <111> 0.7 Glass - soda Polyester 0.6 Concrete 0.5 Fracture Toughness KIC - plane strain fracture toughness Based on data in Table B5, Callister 7e. Composite reinforcement geometry is: f = fibers; sf = short fibers; w = whiskers; p = particles. Addition data as noted (vol. fraction of reinforcement): 1. (55vol%) ASM Handbook, Vol. 21, ASM Int., Materials Park, OH (2001) p. 606. 2. (55 vol%) Courtesy J. Cornie, MMC, Inc., Waltham, MA. 3. (30 vol%) P.F. Becher et al., Fracture Mechanics of Ceramics, Vol. 7, Plenum Press (1986). pp. 61-73. 4. Courtesy CoorsTek, Golden, CO. 5. (30 vol%) S.T. Buljan et al., "Development of Ceramic Matrix Composites for Application in Technology for Advanced Engines Program", ORNL/Sub/85-22011/2, ORNL, 1992. 6. (20vol%) F.D. Gace et al., Ceram. Eng. Sci. Proc., Vol. 7 (1986) pp. 978-82.
The modes of crack surface displacement The three modes of crack surface displacement. (a) Mode I, opening or tensile mode; (b) mode II, sliding mode; and ( c) mode III, tearing mode.
Design Against Crack Growth K ≥ Kc= --Result 2: Design stress dictates max. flaw size. --Result 1: Max. flaw size dictates design stress. amax s fracture fracture no no amax s fracture fracture • Crack growth condition: • Largest, most stressed cracks grow first!
Plane strain fracture toughness Exist when specimen thickness is much greater than the crack dimensions, Kc becomes independent of thickness; under these conditions a condition of plane strain exists. By plane strain we mean that when a load operates on a crack there is no strain component perpendicular to the front and back faces. The Kc value for this thick-specimen situation is known as the plane strain fracture toughness KIc The plane strain fracture toughness KIc is a fundamental material property that depends on many factors, the most influential of which are temperature, strain rate, and microstructure. The magnitude of KIc diminishes with increasing strain rate and decreasing temperature. increases with reduction in grain size
Design Example: Aircraft Wing • Use... --Result: 112 MPa 9 mm 4 mm Answer: • Material has Kc = 26 MPa-m0.5 • Two designs to consider... Design B --use same material --largest flaw is 4 mm --failure stress = ? Design A --largest flaw is 9 mm --failure stress = 112 MPa • Key point: Y and Kc are the same in both designs. • Reducing flaw size pays off!
TS sy larger e TS smaller sy e e Loading Rate • Increased loading rate... -- increases sy and TS -- decreases %EL • Why? An increased rate gives less time for dislocations to move past obstacles. s
(Charpy) final height initial height Impact Testing • Impact loading: -- determine the fracture properties of materials -- determine DBTT or not for materials (Izod)
Temperature DBTT – is the material a ductile-to-brittle transition with decreasing temperature and, if so, the range of temperatures over which it occur • Ductile-to-Brittle Transition Temperature (DBTT)... FCC metals (e.g., Cu, Ni) BCC metals (e.g., iron at T < 914°C) polymers Impact Energy Brittle More Ductile s High strength materials ( > E/150) y Temperature Ductile-to-brittle transition temperature For steel
Structures constructed from alloys that exhibit this ductile-to-brittle behavior should be used only at temperatures above the transition temperature, to avoid brittle and catastrophic failure. Classic examples of this type of failure occurred, with disastrous consequences, during World War II when a number of welded transport ships, away from combat, suddenly and precipitously split in half. The vessels were constructed of a steel alloy that possessed adequate ductility according to room-temperature tensile tests. The brittle fractures occurred at relatively low ambient temperatures, at about 4C (40F), in the vicinity of the transition temperature of the alloy. Each fracture crack originated at some point of stress concentration, probably a sharp corner or fabrication defect, and then propagated around the entire girth of the ship
Design Strategy:Stay Above The DBTT! • Pre-WWII: The Titanic • WWII: Liberty ships • Problem: Used a type of steel with a DBTT ~ Room temp.
specimen compression on top motor counter bearing bearing flex coupling tension on bottom s s max S s m s time min 2. Fatigue • Fatigue = failure under dynamics and fluctuating stress(cyclic). • Stress varies with time. -- key parameters are S, sm, and frequency • Key points: Fatigue... --can cause part failure, even though smax < sc. --causes ~ 90% of mechanical engineering failures.
Mean stress Range of stress Stress amplitude Stress ratio
Fatigue Design Parameters S-N curve S = stress amplitude case for unsafe steel (typ.) Sfat safe 3 5 7 9 10 10 10 10 N = Cycles to failure • Sometimes, the fatigue limit is zero! S = stress amplitude case for Al (typ.) unsafe safe 3 5 7 9 10 10 10 10 N = Cycles to failure • Fatigue limit, Sfat: --no fatigue if S < Sfat
The important parameters that characterize a material’s fatigue behavior are fatigue limit: This fatigue limit represents the largest value of fluctuating stress that will not cause failure for essentially an infinite number of cycles(below which fatigue failure will not occur.( most nonferrous alloys (Al,Cu,…)don’t have FL fatigue lifeNf . It is the number of cycles to cause failure at a specified stress level, as taken from the S–N plot
Fatigue Mechanism • The process of fatigue failure is characterized by three distinct steps: (1) crack initiation, wherein a small crack forms at some point of high stress concentration; (2) crack propagation, during which this crack advances incrementally with each stress cycle; and (3) final failure, which occurs very rapidly once the advancing crack has reached a critical size. • Cracks associated with fatigue failure almost always initiate (or nucleate) on the surface of a component at some point of stress concentration. Crack nucleation sites include surface scratches, sharp fillets, keyways, threads, dents, and the like. In addition, cyclic loading can produce microscopic surface discontinuities resulting from dislocation slip steps which may also act as stress raisers, and therefore as crack initiation sites.
Fatigue Mechanism crack origin • Crack grows incrementally typ. 1 to 6( constant) increase in crack length per loading cycle • Failed rotating shaft --crack grew even though Kmax < Kc --crack grows faster as • Ds increases • crack gets longer • loading freq. increases.
Factors that affect fatigue life • Mean stress • Surface effects • Environmental effects
1. Mean stress • The dependence of fatigue life on stress amplitude is represented on the S–N plot. increasing the mean stress level leads to a decrease in fatigue life
2. Surface effect For many common loading situations, the maximum stress within a component or structure occurs at its surface. consequently, most cracks leading to fatigue failure originate at surface positions, specifically at stress amplification sites • Design factor: Any notch or geometrical discontinuity can act as a stress raiser and fatigue crack initiation site; these design features include grooves, holes, keyways, threads and so on. • Surface treatment: 1.improving the surface finish by polishing will enhance fatigue life significantly 2. imposing residual compressive stresses within a thin outer surface layer • Case (layer)hardening: is a technique whereby both surface hardness and fatigue life are enhanced for steel alloys. This is accomplished by a carburizing or nitriding process whereby a component is exposed to a carbonaceous or nitrogenous atmosphere at an elevated temperature.
Environmental effects • thermal fatigue : is normally induced at elevated temperatures by fluctuating thermal stresses; mechanical stresses from an external source need not be present. The origin of these thermal stresses is the restraint to the dimensional expansion and/or contraction that would normally occur in a structural member with variations in temperature. The magnitude of a thermal stress developed by a temperature change T is dependent on the coefficient of thermal expansion l and the modulus of elasticity E according to Influence of stress and temperature T on creep behavior.
Corrosion fatigue: Failure that occurs by the simultaneous action of a cyclic stress and chemical attack • Small pits may form as a result of chemical reactions between the environment and material, which serve as points of stress concentration, and therefore as crack nucleation sites. • Severalapproaches to corrosion fatigue prevention • exist: • - apply protective surface coatings, • - select a more corrosion resistant material • - reduce the corrosiveness of the environment.
S = stress amplitude Increasingm s near zero or compressive m s moderate tensile m s Larger tensile m N = Cycles to failure --Method 1: shot peening --Method 2: carburizing shot C-rich gas put surface into compression 2. Remove stress concentrators. better bad bad better Improving Fatigue Life 1. Impose a compressive surface stress (to suppress surface cracks from growing)
3. Creep • The time-dependent permanent deformation that occurs when material are subjected to a constant load or stress; for most materials it is important only at elevated temperatures. • For metals it becomes important only for temperatures greater than about 0.4Tm (Tm absolute melting temperature).
s,e t 0 Creep Sample deformation at a constant stress (s) vs. time s Primary Creep: slope (creep rate) decreases with time. Secondary Creep: steady-statei.e., constant slope. Tertiary Creep: slope (creep rate) increases with time,i.e.acceleration of rate.
Creep • Occurs at elevated temperature, T > 0.4 Tm tertiary primary secondary elastic
Secondary Creep • Strain rate is constant at a given T, s -- strain hardening is balanced by recovery stress exponent (material constant) activation energy for creep (material constant) strain rate applied stress material const. • With either increasingstress or temperature, the following will be noted: • the instantaneous strain at the time of stress application increases; • the steady-state creep rate is increased; • (3) the rupture lifetime is diminished.
Stress (MPa) 2 0 0 427°C 10 0 • Strain rate increases for higher T, s 538 °C 4 0 2 0 649 °C 10 -2 -1 10 10 1 e Steady state creep rate (%/1000hr) s Stress (logarithmic scale) versus rupture lifetime (logarithmic scale) for a low carbon–nickel alloy at three temperatures Stress (logarithmic scale) versus steady-state creep rate (logarithmic scale) for a low carbon–nickel alloy at three temperatures.
• Failure: along grain boundaries. g.b. cavities 100 applied stress 20 Stress, ksi 10 data for S-590 Iron 1 12 16 20 24 28 3 24x103 K-log hr L(10 K-log hr) • Time to rupture, tr function of applied stress temperature 1073K Ans: tr = 233 hr time to failure (rupture) Creep Failure • EX. Estimate rupture time S-590 Iron, T = 800°C, s = 20 ksi From V.J. Colangelo and F.A. Heiser, Analysis of Metallurgical Failures (2nd ed.), Fig. 4.32, p. 87, John Wiley and Sons, Inc., 1987. (Orig. source: Pergamon Press, Inc.)
ALLOYS FOR HIGH-TEMPERATURE USE There a several factors that affect the creep characteristics of metals. These include melting temperature, elastic modulus, and grain size. In general, the higher the melting temperature, the greater the elastic modulus, and the larger the grain size, the better is a material’s resistance to creep. Stainless steels, the refractory metals and the superalloys are especially resilient to creep and are commonly employed in high-temperature service applications. The creep resistance of the cobalt and nickel superalloys is enhanced by solid-solution alloying, and also by the addition of a dispersed phase which is virtually insoluble in the matrix. In addition, advanced processing techniques have been utilized; one such technique is directional solidification, which produces either highly elongated grains or single-crystal
4. Corrosion • Corrosion is breaking down! of essential properties in a material due to reactions with its surroundings. In the most common use of the word, this means a loss of an electron of metals reacting with waterand oxygen • Weakening of iron due to oxidation of the iron atoms is a well-known example of electrochemical corrosion. This is commonly known as rust This type of damage usually affects metallic materials, and typically produces oxide(s) and/or salt(s) of the original metal
Rust, the most familiar example of corrosion -- Most structural alloys corrode merely from exposure to moisture in the air, but the process can be strongly affected by exposure to certain substances. Corrosion can be concentrated locally to form a pit or crack, or it can extend across a wide area to produce general deterioration