Download
1 / 20
220 likes | 421 Views
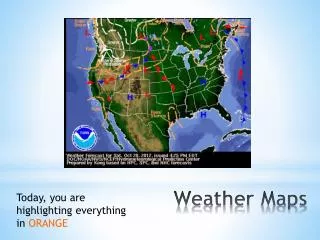
Weather Maps We use weather maps to give us a pictorial view of the weather when dealing with large amounts of data. We typically report: Temperature Sea Level Pressure Moisture Winds (Speed and Direction) Cloud Cover Precipitation. Surface Station Model.

E N D
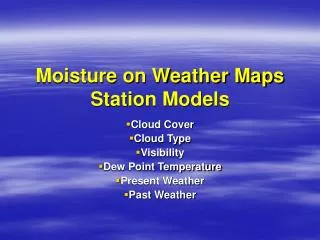
Weather Maps • We use weather maps to give us a pictorial view of the weather when dealing with large amounts of data. • We typically report: • Temperature • Sea Level Pressure • Moisture • Winds (Speed and Direction) • Cloud Cover • Precipitation
Surface Station Model • A station model is a pictorial way of representing the weather data recorded at a specific site. A simplified station model This represents the typical data reported at a station. Some stations may report more or less.
Surface Station Model A simplified station model T = Temperature (Fahrenheit) Td = Dew Point Temperature Vis. = Visibility (miles) Wx = Present Weather Press = Sea Level Pressure Precip. = Precipitation amount (Liquid Equiv. In inches) dd = Wind Direction (degrees) ff = Wind Speed (knots)
Surface Station Model A station model EXAMPLE Temperature = 90 F Dew Point = 68 F Visibility = 10 Miles Present Weather = Rain Shower Press = 1001.0 mb Precipitation = 0.05 inches Wind Direction = North -- 00 Degrees Wind Speed = 24 knots Cloud cover = 9/10 Clouds
Surface Closeup At Oklahoma City (OKC) Temperature = 82 F Pressure 1001.0 mb Dew Point = 64 F Weather = Partly Cloudy Winds = Southeast at 3-7 knots.
Surface Station Model • Comments on reporting pressure • The pressure is reported in millibars (tens, units, and tenths -- the leading 9 or 10 is omitted) reduced to seal level. Examples 1014.7 mb 986.3 mb 147 863
Surface Station Model • Comments on reporting wind • The direction is reported, in degrees, from where the wind comes from. Examples Southwest Wind North Wind East Wind
Surface Station Model • Comments on reporting wind • The speed is indicated by the barbs or pennants attached to the “arrow”. • Half barb represents 3-7 knots • Full barb represents 8-12 knots • Pennant represents 50 knots Examples Calm 13 - 17 Knots 58 - 62 Knots
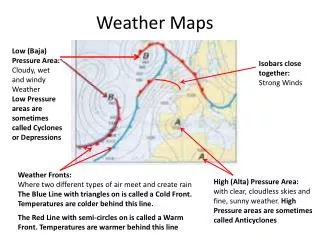
Surface Maps -- Pressure Systems • Low Pressure • Typical Weather: • Cloudy • Windy • Warmer • Precipitation • Flow around a low is cyclonic (counterclockwise in the Northern Hemisphere) • Stronger pressure gradient • Pressure changes more rapidly over a given distance.
Surface Maps -- Pressure Systems • High Pressure • Typical Weather: • Clear • Light Winds • Cooler • Dry • Flow around a low is anticyclonic (clockwise in the Northern Hemisphere) • Weaker pressure gradient • Pressure changes less rapidly over a given distance.
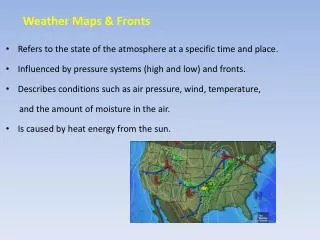
Surface Analysis Fronts: Boundaries between large regions of air (air masses) with differing temperature, humidity, or both. • Warm Front • Long periods of clouds, winds, and precipitation • Warm, moist air after frontal passage • Occasionally produces severe weather • Denoted by a red line with red half-circles that point toward cold air.
Surface Analysis Fronts: Boundaries between large regions of air (air masses) with differing temperature, humidity, or both. • Cold Front • Shorter periods of clouds, winds, and precipitation • Cold, dry air after frontal passage • Often produces severe weather in spring • Denoted by a blue line with blue triangles that point toward warm air.
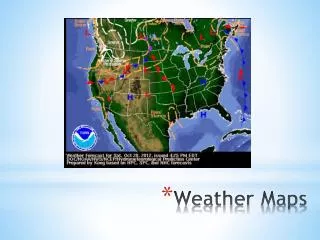
Surface Analysis -- 12 Jan 98 Snow Cold Front High Pressure Warm Front Low Pressure Rain Fog Isobars: Lines of Constant Pressure
Surface Analysis -- 20 Aug 98 Cold Front Low Pressure High Pressure Tropical Depression Isobars: Lines of Constant Pressure Image from: The Weather Channel
Upper Air Station Model • A station model is a pictorial way of representing the weather data recorded at a specific site. A simplified station model This represents the typical data reported at a station. Some stations may report more or less.
Upper Air Station Model A simplified station model T = Temperature (Celsius) DD = Dew Point Depression Z = Height of the constant pressure surface dd = Wind Direction (degrees) ff = Wind Speed (knots)
Upper Air Station Model A station model EXAMPLE Temperature = -21 C Dew Point Depression = 10 C Height = 5460 m Wind Direction = North -- 00 Degrees Wind Speed = 50 knots
Upper Air Station Model • Height of pressure surfaces • 850 mb • 1100 - 1800 m • Recorded as 100 - 800 with the leading “1” omitted • 700 mb • 2700 - 3500 m • Recorded as 700 - 500 with the leading “2” or “3” omitted
Upper Air Station Model • Height of pressure surfaces • 500 mb • 4700 - 6000 m • Recorded as 470 - 600 with the trailing “0” omitted • 250 mb • 9000 - 11000 m • Recorded as 900 - 1110 with the trailing “0” omitted