Download
1 / 58
610 likes | 824 Views
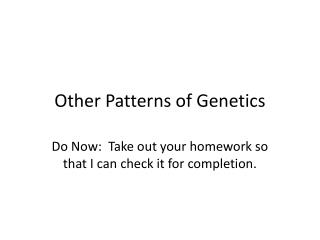
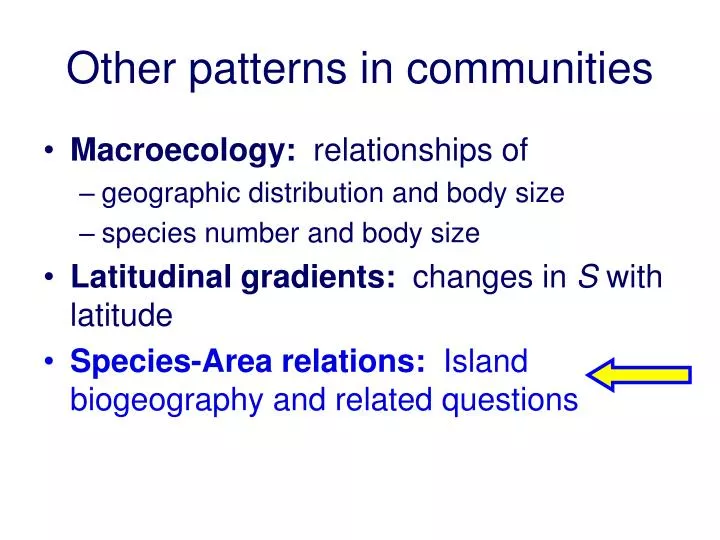
Other patterns in communities. Macroecology : relationships of geographic distribution and body size species number and body size Latitudinal gradients: changes in S with latitude Species-Area relations: Island biogeography and related questions. S. A. Species-area relationships.

E N D
Other patterns in communities • Macroecology: relationships of • geographic distribution and body size • species number and body size • Latitudinal gradients: changes in S with latitude • Species-Area relations: Island biogeography and related questions
S A Species-area relationships • Islands, either oceanic or habitat • Selected areas within continents • How is number of species related to area?
Mathematics S = c Az • S is number of species • A is area sampled • c is a constant depending on the taxa & units of area • z is a dimensionless constant • often 0.05 to 0.37
ln (S ) ln (A ) Often linearized • ln (S ) and ln (A ) • ln (S ) = ln (c ) + z ln (A ) • z is now the slope • ln (c ) is now the intercept
Theory & Hypotheses • Area per se hypothesis • why S goes up with A • why S = c A z • why z takes on certain values • Habitat heterogeneity hypothesis • why S goes up with A • Passive sampling hypothesis • why S goes up with A
Sn ni Area per se • large heterogeneous assemblage log normal distribution of species abundances • assume log normal ("canonical log normal") • Abundance class for most abundant species = abundance class with most individuals • constrains variance (s2) of the distribution • assume that N increases linearly with A • Yield: unique relationship: S = c Az • for "canonical" with S > 20: S = c A0.25
Area per se • z varies systematically • larger for real islands vs. pieces of contiguous area • z does not take on any conceivable value • if log normal had s2 = 0.25 (very low) • then z 0.9 … which is virtually unknown in nature • implies constraints on log normal distributions
I ST S Dynamics of the area per se hypothesis • open island of a given area • rate of immigration (sp. / time) = I initially high • once a species is added, I declines • nonlinear: • 1st immigrants best dispersers • last are poorest dispersers
E ST S Dynamics of the area per se hypothesis • rate of extinction (sp. / time) = E initially 0 • as species are added, E increases • nonlinear: • lower n as S increases • more competition as S increases
RATE E I S S* Dynamic equilibrium • equilibrium when E = I • determines S* • how are rates related to area?
Esmall Elarge RATE I S*small S S*large Effect of area on S* • 2 islands equally far from mainland • large & small • extinction rate greater on small • smaller n’s • greater competition • under this hypothesis I isnotrelated to area
Area per se • Neutral hypotheses vs. Niche hypotheses • Neutral hypotheses – presume that biological and ecological differences between species, though present, are not critical determinants of diversity • Area per se is a neutral hypothesis • S depends only on the equilibrium between species arrival and extinction • Large A large populations low prob. extinction
Niche-based hypotheses • Niche hypotheses - presume that that biological and ecological differences between species are the primary determinants of diversity • Niche differences enable species to coexist stably • Does not require equilibrium between extinction and arrival
Habitat heterogeneity • Niche-based hypothesis • Larger islands more habitats • Why? • More habitats more species • does not require competition • does not require equilibrium • does not exclude competition or equilibrium
RATE E Ilarge Ismall S S*small S*large Passive sampling • Larger islands bigger “target” • Neutral hypothesis • More immigration more species • competition & equilibrium not necessary (but possible) • under this hypothesis E is notrelated to area
Processes • Interspecific competition
Competition • Competition occurs when: • a number of organisms use and deplete shared resources that are in short supply • when organisms harm each other directly, regardless of resources • interspecific, intraspecific
competitor #1 competitor #1 + - competitor #2 + - competitor #2 - - resource Interference competition Resource competition
Interference Direct attack Murder Toxic chemicals Excretion Resource Food, Nutrients Light Space Water Depletable, beneficial, & necessary Competition
N t Competition & population • Exponential growth • dN / dt = r N • r = exponential growth rate • unlimited growth • Nt= N0ert
Competition & population K • Logistic growth: [ K - N ] dN/dt = r N K • r = intrinsic rate of increase • K = carrying capacity N t
Carrying capacity • Intraspecific competition • among members of the same species • As density goes up, realized growth rate (dN / dt) goes down • What about interspecific competition? • between two different species
Lotka-Volterra Competition N1 N2 r1 r2 K1 K2 • [ K1 - N1- a2 N2 ] • dN1/dt = r1 N1 • K1 • [ K2 - N2- a1 N1 ] • dN2/dt = r2 N2 • K2
Lotka-Volterra Competition • a1 = competition coefficient • Relative effect of species 1 on species 2 • a2 = competition coefficient • Relative effect of species 2 on species 1 • equivalence of N1 and N2
Effects of Ni & Ni’ on growth • [ K1 - N1- a2 N2 ] • dN1/ dt = r1 N1 • K1 • In the numerator, a single individual of N2 has a equivalent effect on dN1 / dtto a2 individuals of N1
Competition coefficients: a’s • Proportional constants relating the effect of one species on the growth of a 2nd species to the effect of the 2nd species on its own growth • a2 > 1 impact of sp. 2 on sp. 1 greater than the impact of sp. 1 on itself • a2 < 1 impact of sp. 2 on sp. 1 less than the impact of sp. 1 on itself • a2 = 1 impact of sp. 2 on sp. 1 equals the impact of sp. 1 on itself
total population growth dNi / dt = riNi [Ki-Ni-ai’Ni’]/Ki per capita population growth dNi/ Nidt = ri[Ki-Ni-ai’Ni’]/Ki Notation dNi / dtvs. dNi / Nidt
Lotka-Volterra equilibrium • at equilibrium • dN1 / N1dt = 0 & dN2 / N2dt= 0 • also implies dN1 / dt = dN2 / dt= 0, so... • 0 = r1N1[ (K1-N1-a2N2)/ K1] • 0 = r2N2[ (K2-N2-a1N1)/ K2] • true if N1 = 0 or N2 = 0 or r1= 0 or r2 = 0
Lotka-Volterra equilibrium • for 0 = r1N1[ (K1-N1-a2N2)/ K1] • true if 0 = (K1-N1-a2N2)/ K1 • if N2 = 0, implies N1 = K1 (logistic equilibrium) • as N1 0, implies a2N2=K1 or N2 = K1 / a2 • plot as graph of N2vs. N1
N2 K1/a2 dN1/dt<0 dN1/dt>0 N1 K1 Equilibrium • dNi / dt = 0 for both species • K1 - N1 -a2N2 = 0 and K2 - N2 -a1N1 = 0 Zero Growth Isocline (ZGI) for species 1
N2 dN2 /N2 dt < 0 K2 Zero Growth Isocline (ZGI) dN2 /N2 dt = 0 dN2 /N2 dt > 0 0 N1 K2/a1 Zero growth isoclinefor sp. 2
N2 dN1 / N1 dt< 0 K1 /2 Zero Growth Isocline (ZGI) dN1/N1dt = 0 dN1 /N1 dt> 0 0 N1 K1 Zero growth isocline for sp. 1
dN1 / N1dt Isocline in 3 dimensions r1 K1 0 N1 K1 / 2 Zero Growth Isocline... dN1/N1dt = 0 N2
K1 0 N1 K1 / 2 Zero Growth Isocline ... dN1/N1dt = 0 N2 Isocline in 3 dimensions
N2 K1 / 2 Zero Growth Isocline... dN1/N1dt = 0 K1 0 N1 Isocline
Two Isoclines on same graph • May or may not cross • Indicates whether two competitors can coexist • For equilibrium coexistence, both must have • Ni > 0 • dNi/ Ni dt = 0
N2 K1/a2 dN1 / N1dt = 0 K2 dN2 / N2dt = 0 0 K1 N1 K2/a1 Species 1 “wins” Lotka-Volterra Zero Growth Isoclines • K1 / a2 > K2 • K1 >K2 / a1 • Region dN1/N1dt>0 & dN2/N2dt>0 • Region dN1/N1dt>0 & dN2/N2dt<0 • Region dN1/N1dt<0 & dN2/N2dt<0
N2 K2 dN2 / N2dt = 0 K1/a2 dN1 / N1dt = 0 0 N1 K1 K2/a1 Species 2 “wins” Lotka-Volterra Zero Growth Isoclines • K2> K1 / a2 • K2 / a1>K1 • Region dN1/N1dt>0 & dN2/N2dt>0 • Region dN1/N1dt<0 & dN2/N2dt>0 • Region dN1/N1dt<0 & dN2/N2dt<0
Competitive Asymmetry • Competitive Exclusion • Suppose K1 K2. What values of 1 and a2 lead to competitive exclusion of sp. 2? • a2 < 1.0 (small) and a1 > 1.0 (large) • effect of sp. 2 on dN1/ N1dt less than effect of sp. 1 on dN1/ N1dt • effect of sp. 1 on dN2/ N2dt greater than effect of sp. 2 on dN2/ N2dt
K1/a2 Stable coexistence dN1 / N1dt = 0 K2 dN2 / N2dt = 0 0 K1 K2/a1 N1 Lotka-Volterra Zero Growth Isoclines N2 • K1 / a2 > K2 • K2 / a1>K1 • Region both species increase • Regions & one species decreases & one species increases • Region both species decrease
Stable Competitive Equilibrium • Competitive Coexistence • Suppose K1 K2. What values of 1 and a2 lead to coexistence? • a1 < 1.0 (small) and a2 < 1.0 (small) • effect of each species on dN/Ndt of the other is less than effect of each species on its own dN/Ndt • Intraspecific competition more intense than interspecific competition
Lotka-Volterra Zero Growth Isoclines N2 K2 Unstable two species equilibrium • K2 > K1 / a2 • K1 > K2 / a1 • Region both species increase • Regions & one species decreases & one species increases • Region both species decrease dN2 / N2dt = 0 K1/a2 dN1 / N1dt = 0 0 K2/a1 K1 N1
Unstable Competitive Equilibrium • Exactly at equilibrium point, both species survive • Anywhere else, either one or the other “wins” • Stable equilibria at: • (N1 = K1 & N2 = 0) • (N2 = K2 & N1 = 0) • Which equilibrium depends on initial numbers • Relatively more N1and species 1“wins” • Relatively more N2 and species 2 “wins”
Unstable Competitive Equilibrium • Suppose K1 K2. What values of 1 and lead to coexistence? • a1> 1.0 (large) and a2 >1.0 (large) • effect of each species on dN/Ndt of the other is greater than effect of each species on its own dN/Ndt • Interspecific competition more intense than intraspecific competition
Lotka-Volterra competition • Four circumstances • Species 1 wins • Species 2 wins • Stable equilibrium coexistence • Unstable equilibrium; winner depends on initial N’s • Coexistence only when interspecific competition is weak • Morin, pp. 34-40
Competitive Exclusion Principle • Two competing species cannot coexist unless interspecific competition is weak relative to intraspecific competition • What makes interspecific competition weak? • Use different resources • Use different physical spaces • Use exactly the same resources, in the same place, at the same time Competitve exclusion
Model assumptions • All models incorporate assumptions • Validity of assumptions determines validity of the model • Different kinds of assumptions • Consequences of violating different kinds of assumptions are not all the same
Simplifying environmental assumption • The environment is, with respect to all properties relevant to the organisms: • uniform or random in space • constant in time • realistic? • if violated need a better experimental system
Simplifying biological assumption • All the organisms are, with respect to their impacts on their environment and on each other: • identical throughout the population • clearly must be literally false • if seriously violated need to build a different model with more realistic assumptions
Explanatory assumptions • What we propose as an explanation of nature (our hypothesis) • r1, r2, K1, K2, a1, a2 are constants • competition is expressed as a linear decline in per capita growth (dN / N dt ) with increasing N1or N2 • Some proportional relationship exists between the effects of N1 and N2 on per capita growth • If violated model (our hypothesis) is wrong