Download
1 / 1
10 likes | 70 Views
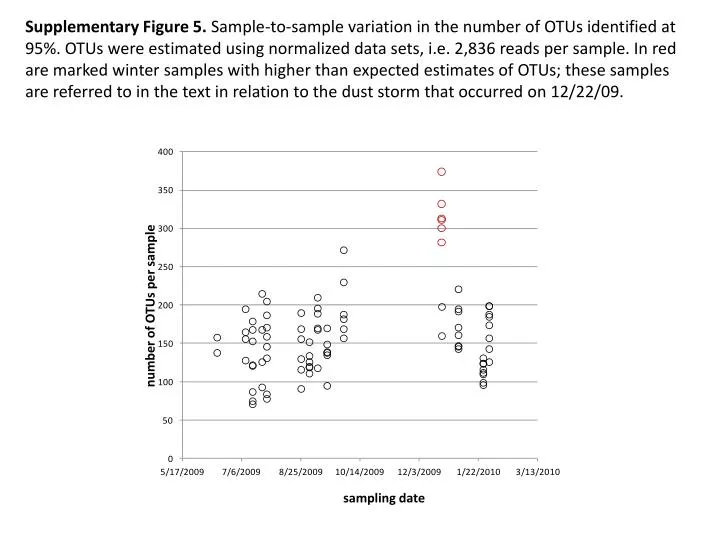
Supplementary Figure 5 showcasing the variation in OTU estimates with normalized data sets for a sampling date with unexpected high OTU estimates in winter samples after a dust storm on 12/22/09.

E N D
Supplementary Figure 5. Sample-to-sample variation in the number of OTUs identified at 95%. OTUs were estimated using normalized data sets, i.e. 2,836 reads per sample. In red are marked winter samples with higher than expected estimates of OTUs; these samples are referred to in the text in relation to the dust storm that occurred on 12/22/09. number of OTUs per sample sampling date


