Download
1 / 60
630 likes | 843 Views
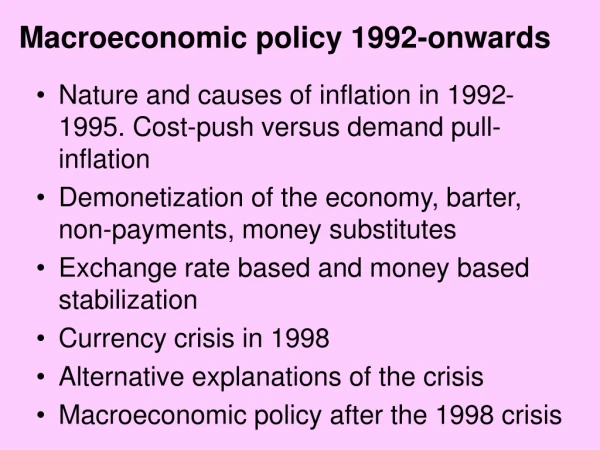
Macroeconomic Policy Fundamentals. Chapter 13. Discussion Topics. Characteristics of money Federal Reserve System Changing the money supply Money market equilibrium Effects of monetary policy on economy The federal budget deficit The national debt Fiscal policy options. 2.

E N D
MacroeconomicPolicyFundamentals Chapter 13
Discussion Topics • Characteristics of money • Federal Reserve System • Changing the money supply • Money market equilibrium • Effects of monetary policy on economy • The federal budget deficit • The national debt • Fiscal policy options 2
Functions of Money • Medium of exchange – facilitates payment to others for goods and services • Unit of accounting – assessing profitability of businesses, household budgets and aggregate variables like GDP • Store of value – money is a liquid asset which has value in investment portfolios and cash flow decisions of businesses and households Page 244 3
Functions of the Federal Reserve System • Supply the economy with paper currency • Supervise member banks • Provide check collection and clearing services • Maintain the reserve balances of depository institutions • Lend to depository institutions • Act at the federal government’s banker and fiscal agent • Regulate the money supply 4 Page 246-247
Location of the 12 District Federal Reserve Banks 5 Page 246
The Fed’s Policy Tools • Reserve requirements – depository institutions are required to maintain a specific fraction of their customers’ deposits as reserves. • Discount rate – rate depository institutions pay when they borrow from the Fed • Open market operations – Fed can buy or sell government securities to alter the money supply 6 Page 248-249
Role of the Board of Governors of the Federal Reserve System Page 247 7
Key role played by the Federal Open Market Committee (FOMC) Page 247 8
Role of the 12 District Federal Reserve Banks located throughout the country 10 Page 247
Change in the Money Supply • Existing money supply curve • Perpendicular to the quantity axis • → it is unaffected by the interest rate 12 Page 253
Change in the Money Supply Expansionary monetary policy action will shift MS curve to the right over a period of 12 mo. or so. Page 253 13
Change in the Money Supply Contractionary monetary policy actions will shift the money supply curve left 14 Page 253
Ag Bank depositor sells $1 million in gov’t securities to the Fed • Sale proceeds are deposited in his bank. • W/ fractional reserve requirement ratio is 20% → Bank Ag can ↑ the volume of its loans by $800,000. • Suppose loan proceeds are deposited in Bank B. • Etc…….. 15 Page 251
Change in the Money Supply • We can skip tracing deposits through the economy via the following money supply (MS) equation: • MS= (1.0 ÷ RR) × TR = MM × TR • where TR represents total reserves and RR is the reserve requirement ratio. • The expression within the parentheses is known as the money multiplier • → In terms of the money supply change (ΔMS): • MS = (1.0 ÷ RR) × TR = MM × TR 16 Page 252-253
Change in the Money Supply • Using the example in Table 13.3 of the $1 million deposit on page 307 and 20% reserve requirements ratio, we see that ΔMS is • MS = (1.0 ÷ .20) x TR • = 5.0 x $1 million • = $5 million • This results in Loansof • loans = MS - TR • = $5 million - $1 million • = $4 million Table 13.3 bottom line 17 Page 251-253
Change in money supply Change in loan volume Initial infusion + = 18 Page 251
Impacts of Policy Tools Expansionary actions:Effects of action: Fed buys securities Total reserves increase Fed lowers the discount rate Total reserves increase Fed lowers required reserve ratio Money multiplier increases Contractionary actions:Effects of action: Fed sells securities Total reserves decrease Fed raises the discount rate Total reserves decrease Fed raises required reserve ratio Money multiplier decreases Bernanke 19 Page 253
Demand for Money • Transactions demand for money – carry cash to pay for normal expenditures • Precautionary demand for money – carry cash to cover unexpected expenditures • Speculative demand for money – hold cash as an asset in investment portfolios since the value of cash does not decline during periods of falling asset prices Page 254 21
The money demand curve is given by equation (16.5): • MD= α – β x IR + γ x NI • R is the interest rate • NI is national income • – β is the MD slope (i.e., MD÷IR) • γrepresents MD÷NI Page 255 22
↑ in income → ↑ demand for money MD = α – β x IR + γ x NI 23 Page 255
Determination of Interest Rate Money market interest rate given by intersection of demand and supply 24 Page 255
MS* Expansionary monetary policy lowers interest rates 0.06 Page 255 25
MS* Contractionary monetary policy raises interest rates 0.14 26 Page 255
The full effects of this change could take 12 months or more to register in bank deposits 27 Page 256
A change in MSwill alter the equilibrium money market interest rate 28 Page 256
From Chapter 12 • ΔIR → movement along the planned investment function • ↑ or ↓new investment 29 Page 256
From Chapter 12 • ↑ investment expenditures, a component of GDP • ↑ demand for labor → ↓ unemployment • further ↑ in NI 30 Page 256
What is the magnitude of the recessionary gap? • YFE – Y1 32 Page 257
Use expansionary monetary policy • Push aggregate demand from AD1 to AD3 • ↑ real GDP from Y1 to Y3 • → only ↑ general price level to P3 33 Page 257
Recessionary gap of YFE – Y1 is partially closed to YFE – Y3 Inflation rate = % Δ in price = (P3 – P0) ÷P0 34 Page 257
Use of expansionary monetary policy to push AD from AD3 to AD4 • ↑real GDP from Y3to YFE (full employment GDP) • ↑general price level to P4 Recessionary gap fully closed 35 Page 257
Use of expansionary monetary policy to attain YPOT • Shift aggregate demand to AD5 • Will ↑ general price level to P5 Inflation rate (P5 – P4) ÷ P4 Inflationary gap created 36 Page 257
Interest Rate Impacts on a 10-Year $150K Business Loan 38 Page 259
Interest Rate Impacts on a 20- Year $100K Home Mortgage Page 259 39
What is Fiscal Policy? • Taxation by federal, state and local governments • Government spending by federal state and local governments • Budget deficit and the national debt 40 Page 259
States Without Income Tax Eight states do not have a state income tax 41
State and Local Taxes • Alaska, thanks to oil reserves, has the lowest tax burden • Maine registered the highest state tax burden • Major sources are of government revenue are sales and property taxes 42
↑ spending and tax cuts recently used to stimulate the economy resulted in new budget deficits Budget deficit = Gov’t expenditures > receipts 44 Page 262
% of Total Federal Taxes Individuals vs. Business Individuals and not businesses pay the Bulk of federal taxes. 45 Page 262
A strong economy and controlled spending led to 1st budget surplus in more than 20 years The sub-prime lending defaults and resultingfinancial crisis and deficit spending have led to record high deficits… Page 263 46
Debt and the Deficit • General formula for the National Debt A negative deficit is a surplus National DebtT= National debt(T-1)+ DeficitT The growth in federal debt has grown rapidly over the last 25 years 48 Page 264
National debt grew as deficit spending dominated the last 30 years • Debt as a % of GDP stayed within post-WW II levels Page 265 49
Federal government spending on Agriculture programs is the 4thhighest on this list of total federal spending 50