Download
1 / 21
210 likes | 398 Views
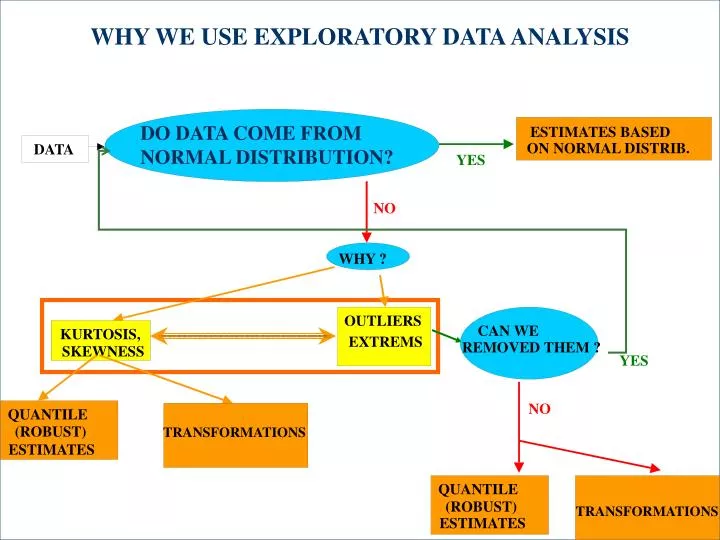
ESTIMATES BASED. ON NORMAL DISTRIB. DATA. YES. NO. WHY ?. OUTLIERS. CAN WE. KURTOSIS ,. EXTR EMS. REMOVED THEM ?. SKEWNESS. YES. NO. QUANTILE. (ROBUST). TRANSFORMA TIONS. ESTIMATES. QUANTILE. (ROBUST). ESTIMATES. WHY WE USE EXPLORATORY DATA ANALYSIS.

E N D
ESTIMATES BASED ON NORMAL DISTRIB. DATA YES NO WHY ? OUTLIERS CAN WE KURTOSIS, EXTREMS REMOVED THEM ? SKEWNESS YES NO QUANTILE (ROBUST) TRANSFORMATIONS ESTIMATES QUANTILE (ROBUST) ESTIMATES WHY WE USE EXPLORATORY DATA ANALYSIS DO DATA COME FROM NORMAL DISTRIBUTION? TRANSFORMATIONS
Graphical: dot plot box plot notched box plot QQ plot histogram density plots Tests: tests of normality minimal sample size METHODS OF EDA
walls inner outer walls outer inner upper kvartil lower quartil interquartile range BOX PLOT median číselná osa
NOTCHED BOX PLOT RF interval estimate of median
measured values ideal coincidence of sample values and theoretical distribution Y: sample quantiles X: theoretical quantiles of analysed distribution Q-Q PLOT
Q-Q plot left sided – skewed to right right sided – skewed to left leptocurtic(„steep“) platycurtic („flat“)
HISTOGRAM correct width of interval:
TRANSFORMATION • Aim of transformation: • reduction of variance • better level of symmetry(normality) of data • Transformation function: • non-linear function • monotonic function
0.8 transformed mean and its 0.6 projection to original data set 0.4 0.2 Transformed data mean of original data 0 - 0.2 - 0.4 0 0.5 1 1.5 2 2.5 3 3.5 4 Original data (tree-rings widths in mm) TRANSFORMATION – basic concept
l = 1 is not included in interval interval estimate estimate of . It means that of parameter l transformation will be probably successful logarithm of maxLF – 0, 5* quantile 2 likelihood function for various values of l optimal l 1.00 TRANSFORMATION– estimate of optimal