Download
1 / 42
420 likes | 433 Views
Explore the role of greenhouse gases in trapping heat, the link between CO2 and temperature over time, and the consequences of global warming. Learn about the IPCC, future climate scenarios, and projected temperature and precipitation changes.

E N D
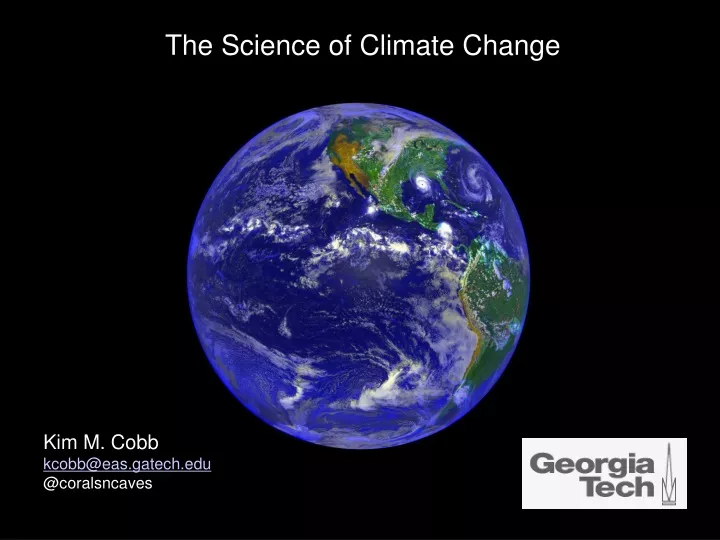
The Science of Climate Change Kim M. Cobb kcobb@eas.gatech.edu @coralsncaves
greenhouse gases in the atmosphere trap heat at the Earth’s surface and prevent it from escaping. • These gases include: • Carbon dioxide CO2 • Methane CH4 • Nitrous oxide N2O • Chlorofluorocarbons • Water vapor H2O • (this is the most important one, by far!) 4 1 without greenhouse gases average temp of Earth would be -18ºC instead of 15ºC 3 2
greenhouse gases trap heat because they absorb radiation in the infrared range, according to specific bond geometries and vibrational modes (ex CO2 below)
The ‘instrumental’ record of climate shows a ~1ºC warming over the last century Source: Hadley CenterUK Met OfficeJones et al., 1999
http://www.metoffice.gov.uk/research/monitoring/climate/surface-temperaturehttp://www.metoffice.gov.uk/research/monitoring/climate/surface-temperature
5ºC A paleo perspective: glacial-interglacial cycles 80 ppm CO2 range = 200 to 280ppm Temperature range = 5ºC
But why hasn’t a +120ppm change in CO2 resulted in a 5+°C warming?
Why do 99.999% of climate scientists believe that CO2 is warming the planet? • Theory predicts that increasing atmospheric CO2 should warm the planet. • Geologic evidence links CO2 and temperature in the past. • The warming is unprecedented in the most recent centuries (dwarfs natural variability). • Climate models show that rising CO2 is necessary to simulate • 20th century temperature trends (solar and volcanic minor players).
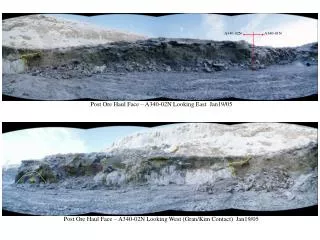
Ice core climate and CO2 records tiny gas bubbles in the ice trap ancient air samples
#2 Atmospheric CO2 and temperature over the past 650 thousand years CO2 and temperature are closely linked on geologic timescales
To understand how climate has changed in the past, we need to use records of climate preserved in ice cores, ancient tree rings, coral bands, and other “paleoclimatic” sources: key is to CALIBRATE to temperature records
#3 The “Hockey Stick” Key Points: error bars increase as you go back in time natural variability accounts for <0.5ºC over the last millennium late 20th century temperature trend is unprecedented
The “hockey stick” has been reproduced many times IPCC WG1, 2007
IPCC WG1, 2007 You need CO2
Consequences of Global Warming (IPCC SPM-AR4) • Reduced uptake of CO2 by land and ocean in warmer climate • Rising sea levels (0.3 to 0.6m by 2100)…. at a minimum • Ocean pH will decrease by 0.14 to 0.35 (already down 0.1) • Snow cover will decrease, permafrost melt, sea ice melt • Extreme events (temperature and precipitation) will become more frequent • Tropical cyclones will become more intense • Storm tracks will move poleward • Rainfall will increase in the high latitudes, decrease in the subtropics • Meridional overturning of Atlantic ocean will decrease
Intergovernmental Panel of Climate Change • formed in 1988 by World Meteorological Organization and the • United National Environmental Program • IPCC’s job: • “...to assess on a comprehensive, objective, open and transparent • basis the scientific, technical and socio-economic information relevant • to understanding the scientific basis of risk of human-induced climate • change, its potential impacts and options for adaptation and mitigation. • IPCC reports should be neutral with respect to policy, although they • may need to deal objectively with scientific, technical and socio- • economic factors relevant to the application of particular policies.” • Assessment reports in: • 1990, 1995, 2001, 2007, and 2013
831 lead authors 10,000+ comments
IPCC pros? IPCC cons?
The uncertain CO2 future Range of CO2 emissions scenarios: Strict international agreements CO2 at 650ppm by 2100 Mid-ground 850ppm by 2100 Business as usual 1370ppm by 2100 Caldeira and Wickett, 2005
The uncertain climate future COLORS= different CO2 paths grey bars= different model responses to different CO2 concentrations Take-homes: Lower limit: 1°C by 2100 Upper limit: 6.5°C by 2100
uneven warming will shift rainfall patterns Projected temperature change: global view Take-homes: -poles warm more -land warms more -ocean warming patchy and complex
Regional models use global model output, run at high-resolution (5km) grid Length of heat waves increase (# days/event) Peak temperatures increase Diffenbaugh et al, 2005 US http://www.usgcrp.gov/usgcrp/nacc/se-mega-region.htm
Projected precipitation change: global view white = models disagree color = models mostly agree stippled = models agree Projecting precipitation is VERY uncertain business, yet extremely critical to human impacts.
Projected precipitation change: regional view change in yearly average precipitation # dry days # heavy rain days mm/day days/yr days/yr Diffenbaugh et al, 2005
IPCC says increase in hurricane intensity “likely” (66%)
Increasing CO2 decreases ocean pH • already measureable • as -0.1 pH unit in 30yrs • will continue as • atmospheric CO2 • increases • effect on marine • calcifiers (corals) • uncertain, but adds • risk • (ex = pteropod exposed • to low pH) Feely et al, 2012 Orr et al, 2005
CERTAIN Warming of 1-6°C by 2100. Sea levels will rise by 6 to 30 inches by 2100. Oceans will continue to acidify. Precipitation patterns will change. More irregular precipitation. Extreme events will increase, hurricanes more intense. Prospect of abrupt climate change. UNCERTAIN
Intergovernmental Panel of Climate Change • formed in 1988 by World Meteorological Organization and the • United National Environmental Program • IPCC’s job: • “...to assess on a comprehensive, objective, open and transparent • basis the scientific, technical and socio-economic information relevant • to understanding the scientific basis of risk of human-induced climate • change, its potential impacts and options for adaptation and mitigation. • IPCC reports should be neutral with respect to policy, although they • may need to deal objectively with scientific, technical and socio- • economic factors relevant to the application of particular policies.” • Assessment reports in: • 1990, 1995, 2001, 2007, and 2013
831 lead authors 10,000+ comments
IPCC pros? IPCC cons?