Download
1 / 40
410 likes | 473 Views
This outline covers the basics of colorimetry, measuring reflectance, fluorescence, and transmittance, and understanding color perception and difference calculations. Learn how color is quantified and how instruments like colorimeters work.

E N D
Colorimetry Silja Holopainen 29.3.2006
Outline • Introduction to colorimetry • Colorimetry in general • Measuring diffuse reflectance • Measuring fluorescence • Measuring transmittance • Measurement geometry and special cases • Conclusion
Introduction • Color has always been important in art, religion and clothing • At present color is also used for signs, safety cloths, paper whitening etc. • It is often important to be able to measure color accurately
What is color? • Electromagnetic radiation between 380-780 nm • Color is one aspect of appearance • Color = light source + object properties + eye + brain • The human eye is most sensitive at 555 nm
The three dimensions of color White • Hue distinguishes blue from green from yellow etc. • Lightness distinguishes light colors from dark colors • Chroma describes how different a color is from grey Lightness Chroma Hue Black Hue Lightness Chroma
Colorimetry • Two objects may appear the same when viewed under one light source, but different under another = metamerism • Metamerism is one of the major industrial problems in color matching • Colorimetry attempts to quantify the perception of color • CIE is a voluntary organization giving recommendations concerning modern colorimetry
Sources and illuminants • Source = physical entity that produces radiation • Illuminant = table of values of spectral power distribution • Illuminant D65 represents average daylight. D50 represents typical indoor light
Color perception • 92 % of men and 99,5 % of women have “normal” color vision • The retina comprises rod cells (night vision) and cone cells (color vision) • Majority of the cells are rod cells • There are three types of cone cells: one has peak sensitivity to blue light, one to green light and one to red light
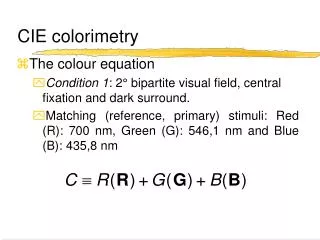
Tristimulus values • All colors can be matched by varying amounts of red, green and blue lights (X, Y and Z) • The amounts of X, Y and Z that must be mixed to match a color are called the tristimulus values • The tristimulus values depend on the reflectance or transmittance of the object, the illuminant and the observer • Pairs of objects are said to match when their tristimulus values are the same
Test Side Matching Side Spectral Light Red + Green + Blue The CIE Standard Observers • In the CIE experiment one half of a circular field is illuminated with spectrum color and the other with a mixture of red, green and blue • The observer adjusts the red, green and blue until it matches the spectrum color • The result is a set of color matching functions used to calculate the tristimulus values
Color difference • Color measurements are mostly made to determine quantitatively whether or not the color of two objects are the same • The total color difference ∆E and its coponents: lightness ∆L, chroma ∆C and hue ∆H can be numerically calculated • The color difference is calculated using the tristimulus values • Numerical color differences may be used for setting tolerances for quality control
Incident Light Reflected Light Absorbed Light Objects • Objects are characterized by the amount of light they emit and reflect or transmit at each wavelength of interest • When light is incident on an object a part of it is absorbed, a part is reflected and a part may be trasmitted • The object may also emit light • All these characteristics contribute to the observed color Transmitted Light
Reflectance • Specular (regular) reflectance = mirror like reflectance • Diffuse reflectance = reflectance in all directions • Gloss = combination of specular and diffuse reflectance Specular Diffuse Glossy
Definitions • Reflectance ρ is the ratio of the total radiant flux reflected by the surface to the flux incident on the surface • Reflectance factor R is the radiant flux reflected in the direction delimited by a given cone to that reflected in the same direction by a perfectly reflecting diffuser identically irradiated • If the solid angle of the cone approaches a limit of 0 or 2π sr, reflectance factor R approaches radiance factor or reflectance ρ
Spectrophotometers and colorimeters • Spectrophotometers are used to measure an object’s reflection characteristics • Colorimeters measure directly tristimulus values or related color coordinates • Colorimeters are less expensive and simple to use but less accurate for determining tristimulus values • Colorimeters determine the color difference between two samples better than tristimulus values • Colorimeters can not determine metamerism
Measuring diffuse reflectance • Instruments measuring the color of reflecting objects consist of an illuminator, a sample holder, and a receiver • The CIE recommends four illuminating and viewing geometries for making reflectance measurements: 45/0, 0/45, d/0, and 0/d • The most common instrument for measuring diffuse reflectance is the integrating sphere • Another type of technique, which is getting more popular, is the angular integration of gonioreflectometric measurement results
Integrating sphere-based techniques • An integrating sphere is coated from the inside with uniformly diffusing material • It has openings for the sample, light source and the receiver • The idea is to either create a diffuse geometry of illumination or to collect light scattered diffusely by the sample
Photometer Specular port Light source Sample d/0 geometry • The light is incident on the sphere wall and is reflected in all directions • As the result of multiple reflections the sample is illuminated from all directions • The sample is viewed in a near normal angle • The specular reflection is directed back to the source and is not measured
Photometer Baffle Light source Sample 0/d geometry • The light is incident on the sample • The sample scatters the light and after multiple reflections it illuminates the detector from all directions • The 0/d geometry is equivalent to the d/0 geometry
Absolute and relative measurement methods • Relative measurement methods produce values that are relative to reference standards • Absolute measurement methods relate the reflectance values of a standard to that of the perfect reflecting diffuser • The relative methods are commonly used in industry, whereas the absolute methods are commonly realized in national standards laboratories
Example of relative method • Signals are measured from the sample, the reference, and the light trap (light incident on the trap) • The light trap gives the dark signal which is subtracted from the results • The sample and reference readings are compared and corrected by the known values of the reference Sample Holder Reference Entrance Reference Holder Light Trap Sample Entrance
C A Light source Sample, Cap or Light trap B Example of absolute method • Taylor’s method: Detector readings when the sample port is not covered (a), it is covered with sphere material (b), and it is covered by the sample (c) • Increase from a to b is proportional to the reflectance of the sphere • The reflectance of the sample is calculated from the ratio of a and c
Goniometric techniques • Gonia = angle • The idea is to illuminate the sample in a certain angle and measure reflectance on the surface of a hemisphere around the sample (or vice versa) • In practice this can be realized with a two-axis goniometer or with a one-axis goniometer by integrating over the polar angles • Enables bidirectional measurements
Gonioreflectometer at TKK • One-axis goniometer • The idea is to illuminate the sample in one direction and measure reflectance over the semiarch • Total diffuse reflectance is obtained by integrating the measured values over the whole hemisphere
Things to be considered • The major source of uncertainty in the system is isochromatic stray light • The biggest contribution is light scattered about the main beam • To compensate the effect a significant correction factor must be used • In our previous system the correction factor was much greater than today due to the more complicated optics
Gonio vs. sphere • Goniometric technique provides bidirectional measurements which are not possible with a sphere • The scattering of light about the main beam is clearly a problem for the gonio but not for the sphere • Systematic deviations have been reported earlier between goniometric and sphere-based techniques • The scattering of light about the main beam is a strong candidate for causing these discrepancies
Fluorescence • A fluorescent material absorbs some of the light incident on it and emits it on higher wavelengths • Part of the energy of the incident photon is lost in internal vibrations and heat • Fluorescence is used e.g. in paper whitening, safety signs and textiles
Commercial fluorescent colorants • Inorganic fluorophors: stable but toxic, used in security markings and fluorescent lamps • Optical whiteners: organic compounds, with excitation at 340-400 nm and emission at 430-460 nm, used heavily in textile, paper and plastic industries to whiten materials • Daylight fluorescent materials: organic compounds, emission and excitation in the visible part of the spectrum, used to color papers and plastics and especially in safety applications
Measuring fluorescence • Polychromatic illumination → appearance and color • Monochromatic illumination → fluorescence separated from reflectance • Often we want to measure fluorescence quantum yield of a material • Fluorescence quantum yield = the number of emitted photons relative to the number of absorbed photons • Quantum yield measurements require monochromatic illumination and viewing
The principle of a CCD • CCD = charge-coupled device • The CCD comprises a two-dimensional array of pixels • Every pixel gathers radiation from a different spatial position → large area of spectrum (~200 nm) measured in one picture
Problems related to fluorescence • Stability of the fluorescent standards • No universally recognized method for characterization of fluorescent instruments • Different instruments give different results • Even the same instrument can give different results over time • Comparing different fluorescent samples is difficult even with the same device
Transmittance measurements • Similarly to reflectance, we can have regular, diffuse or glossy transmittance • Transmittance is utilized e.g. in interference filters and glass filters • The most common measurement geometry is 0/0 Regular Diffuse Glossy
Input signal Transmitted waves add In phase Reflections Fabry-Perot filter and interference filters • The cavity length determines the passed wavelength • MDI filter: thin partially transmitting metal layers • ADI filters: alternating layers of substances with differing refractive indices • Sensitive to temperature and angle Fabry-Perot cavity
Light Source Reference Detector Unit MC Sample A double-beam transfer standard spectrometer at TKK • Used to calibrate filters • The idea is to measure similar beams through the filter and through air • Detector readings from both sample and reference are compared to yield transmittance
Averaging Sphere Detector A OPM Filter-holder Unit A single-beam reference spectrometer at TKK • Detector readings are taken through the filter, through air and dark reading • The filter and light trap can be moved into the beam by a linear translator • The measurement system can be modified to measure e.g. diffuse transmittance Light Source MC
Choosing measurement geometry • Bidirectional illuminating and viewing geometries can be very sensitive to surface texture and polarization • Bidirectional geometries are similar to the way a person evaluates color visually • Diffuse geometries minimize the effect of a sample’s texture and gloss
Special cases • Metallic and pearlescent samples • Retroreflecting samples • Lamps, light sources and displays
Conclusion • Color and appearance are important quantities in several branches of industry e.g. paper, textile and plastic industry • The color and appearance of a material are effected by the light source, observer and spectral properties of the material • Reflectance, transmittance and fluorescence measurements all require special instruments • Fluorescence measurements still present severe problems due to the instability of standards and lack of universal calibration methods of instruments