Download
1 / 16
170 likes | 393 Views
Analysis Drift velocity of the SDD Detector. Martin A. Subieta INFN Torino. Introduction SDD detector Drift velocity Description of ITS Layer 3 & Layer 4 Status of the anodes for all modules Analysis Mean Drift velocity and Time bin for all Modules Mean Drift velocity on the Ladders

E N D
Analysis Drift velocity of the SDD Detector Martin A. Subieta INFN Torino • Introduction • SDD detector • Drift velocity • Description of ITS Layer 3 & Layer 4 • Status of the anodes for all modules • Analysis • Mean Drift velocity and Time bin for all Modules • Mean Drift velocity on the Ladders • Mean Drift velocity and Time bin in function of the runs (fluctuations in the time = 1 minute of data analyzed per run) • Conclusions Palau, Sardegna September 30th
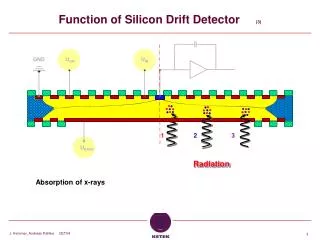
Drift vel Drift vel Side 1 Side 0 SDD Detector Analysis Drift Velocity of the SDD Detector
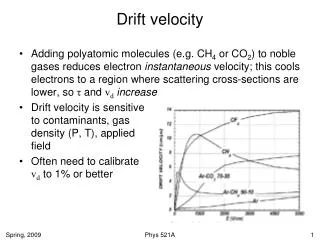
Drift Velocity • The particle cross the detector and produces the electron’s cloud • Electron’s cloud goes until the anodes • The drift velocity is the mean velocity of the electrons Z X Analysis Drift Velocity of the SDD Detector
ITS Layer 3 & Layer 4 Total Modules 260 Analysis Drift Velocity of the SDD Detector
Injectors Lines 2 1 3 Analysis Drift Velocity of the SDD Detector
Status Injector Pad Statistics • Total number of pads are 17160 • 45 % of the pads have status 7 • 18 % have status 6 • 1.2 % have status 5 • 16.8 % have status 1-4 • 19 % have status 0 • Pads 1 & 33 not working for almost all modules Analysis Drift Velocity of the SDD Detector
Statistics of Modules Status 7 • Side 1 pad 7 have more modules with status 7 • Side 0 pad 27 have more modules with status 7 • For both sides we have more of the 50% of the total number of modules with status 7 Analysis Drift Velocity of the SDD Detector
Analysis Mean Drift Velocity (Vdrift) • Analysis of the Vdrift of the pad 7 for one side for the run 51971 (one minute data taking analyzed) • Vdrift distribution for all modules • Time bin (Time bin centroid for the 2nd line injector) distribution for all modules • Vdrift distribution on the ladders • Analysis of the Vdrift for the modules 302 and 372 for 7 runs ( 1 every hour ) • Vdrift in function for the runs of August 14th • taken each hour • Time bin of the pad 7 in function of the same runs Analysis Drift Velocity of the SDD Detector
Mean drift velocity for all modules • Most modules have • Close to 0,08% of error, except for two. • the minimum mean velocity is close to 6.3 (μm/ns) and the maximum close to 6.8 (μm/ns) Layer 4 Layer 3 Module 273 Module 483 Analysis Drift Velocity of the SDD Detector
Time bin centroid for all modules • We take the central injector line for the analysis • Only modules with anodes with status 7 are plotted Layer 4 Layer 3 Analysis Drift Velocity of the SDD Detector
Mean drift velocity for all modules • The picture shows the fluctuations in the modules with status 5,6,7 • Most modules have less than 1 per thousand of error Layer 4 Layer 3 Analysis Drift Velocity of the SDD Detector
Time bin centroid for all modules • We take the central injector line for the analysis • Only modules with anodes 5,6,7 are plotted Layer 4 Layer 3 Analysis Drift Velocity of the SDD Detector
Mean drift velocity on the ladders • Drift velocity depends on temperature • Top layer 3 ≈ 25 °C • Bottom layer 3 ≈ 23 °C • Top layer 4 ≈ 22 °C • Bottom layer 4 ≈ 20 °C Analysis Drift Velocity of the SDD Detector
Mean drift velocity vs runs • Stability of the Vdrift on the time =1 min of data analyzed • fluctuations of the Vdrift around of the mean on the all runs • We have a stability close to 1 per thousand for each run, which remains for 7 runs analyzed Analysis Drift Velocity of the SDD Detector
Time bin in function of the runs • Stability of the Time bin on the time is less than 1 per thousand • This stability remains for all runs analyzed Analysis Drift Velocity of the SDD Detector
Conclusions • The 63% of the pads for all 520 semi-modules have status 6,7. • For the modules with anodes that have status 7 the fluctuations of the drift velocity in 60 events collected in 1 minute , have less than 1 per thousand of error. • Drift velocity observed on the ladders indicate a higher temperature on layer 3 than on layer 4. And a higher temperature on the top ladders than on the bottom ones • 4. We have a difference close to 5 °C between layer 3 and layer 4 • 5. Analysis on Vdrift and the Time bin for six hours (every hour with 1 minute of data analyzed ), shows a stability of the order of 1 per thousand Analysis Drift Velocity of the SDD Detector