Download
1 / 16
160 likes | 276 Views
R-Graphics Day 2. Stephen Opiyo. Basic Graphs. One of the main reasons data analysts turn to R is for its strong graphic capabilities. R generates publication-ready figure s. "graphics" library loads by default when R is started. Ready to go as soon as R opens. Graphing basics.

E N D
R-GraphicsDay 2 Stephen Opiyo
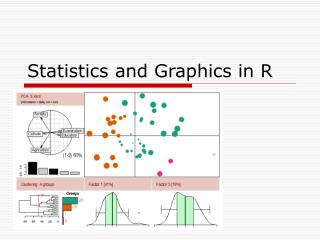
Basic Graphs • One of the main reasons data analysts turn to R is for its strong graphic capabilities. • R generates publication-ready figures. • "graphics" library loads by default when R is started. • Ready to go as soon as R opens.
Graphing basics Plotting commands • High-level functions: Create a new plot on the graphics device • Low-level functions: Add more information to an already existing plot, such as extra points, lines, and labels
Common high-level functions • plot(): A generic function that produces a type of plot that is dependent on the type of the first argument. • hist(): Creates a histogram of frequencies • barplot(): Creates a histogram of values • boxplot(): Creates a boxplot
Example 1 • High-level functions • Download data D2_Data_1 - metabolomics data with 10 peaks identified by Liquid Chromatography-Mass Spectrometer • Open file D2_Example_1.R • R has datasets with packages, e.g., mtcars - Will find out about the data from r using ?mtcars
Lower level graphical functions plot typedescription: type= " " p= points l = lines o= over plotted points and lines b, c= points (empty if "c") joined by lines s= stair steps h= histogram-like vertical lines n = does not produce any points or lines
Lower level graphical functions • pch (plotting characters)=“” : character or numbers • col (color) = “” : character or numbers • lty (line type) = numbers • lwd (line width) = numbers • xlab (x label) =“string”, ylab (y label) =“string” • main (heading) =“string” • xlim (x limit) = c(lo,hi), ylim (y limit) = c(lo,hi) • cexcontrols the symbol size in the plot, default is cex=1,
Lower-level graphing functions • pch=0,square • pch=1,circle • pch=2,triangle point up • pch=3,plus • pch=4,cross • pch=5,diamond • pch=6,triangle point down • pch=7,square cross • pch=8,star • pch=9,diamond plus • pch=10,circle plus • pch=11,triangles up and down • pch=12,square plus • pch=13,circle cross • pch=14,square and triangle down • pch=15, filled square blue • pch=16, filled circle blue • pch=17, filled triangle point up blue • pch=18, filled diamond blue • pch=19,solid circle blue • pch=20,bullet (smaller circle) • pch=21, filled circle red • pch=22, filled square red • pch=23, filled diamond red • pch=24, filled triangle point up red • pch=25, triangle point down red
Lower-level graphing functions Symbol shapes and colors
Lower-level graphing functions • Adding text text() text(x, y, “text”, options) points() add some more points to the graph points(x, y, options) Saving graphs in Rstudio
Example 2 • Download data D2_Data_2 - metabolomics data with 4 peaks identified by Liquid Chromatography-Mass Spectrometer • Open file D2_Example_2.R
3-dimensional Scatterplots • Need a package scatterplot3d • Install package scatterplot3d using install.packages("scatterplot3d") command • Alternatively install using Rstudio using Packages
Multiple graph on one page • Combining multiple plots using par () and mfrow = c(nrows, ncols) to create a matrix of nrows by ncols • ?par • par(mfrow=c(1,2))
Exercise 1 par(mfrow=c(3,5)) plot(D2_Data_2[,2], D2_Data_2[,3], type="p", pch=1, col="1", xlab ="Peak1", ylab ="Peak2", main="Plot of Peak1 vs Peak2", font.main =1) Replace pch=1 and col =1 with 2 to 15: Export the graph and save it as Day_2_Graph.pdf
Basic statistics using R • Open file D2_Example_3.R - metabolomics data with 4 peaks identified by Liquid Chromatography-Mass Spectrometer • Mean, standard deviation, median, mode • Correlation • Ttest
Exercise 2 1) Use R dataset called iris 2) What is the mean and standard deviation of Sepal.Length? 3) Find the correlation between Sepal.Length and Sepal.Width 4) Perform independent ttest between Petal.Length and Petal.Width 5) Test weather the mean of Sepal.Length is equal to 4 6) Find the median of Petal.Length