Download
1 / 10
100 likes | 175 Views
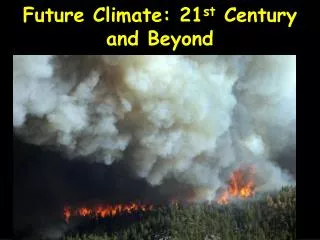
Risk Factor: Mid-Century Warming in the LA Region (Climate Change/Temperature). IPCC Projections. First, a word about emissions scenarios…

E N D
Risk Factor: Mid-Century Warming in the LA Region (Climate Change/Temperature)
IPCC Projections • First, a word about emissions scenarios… These are emissions scenarios associated with the next IPCC 5th Assessment Report, shown here with historical emissions. There are four scenarios. We will focus here on the red curve (RCP8.5 “business as usual”) and the blue curve (RCP2.6 “mitigation”).
IPCC Projections A single emissions scenario results in different global climate model responses. Here are the responses for RCP8.5 “business as usual” and RCP2.6 “mitigation” scenarios.
Topography Topography from a typical global climate model (100-200 km) Topography from our high resolution regional climate model (18, 6, 2 km)
Topography Topography and coastline are very well represented in the 2-km resolution regional climate model San Joaquin Valley Tehachapi Mtns. Mojave Desert San Gabriel Mtns. LA Irvine Santa Monica Mtns
Surface Warming Most likely seasonal-mean surface air temperature change (future minus baseline) in degrees Fahrenheit for the RCP8.5 emissions scenario. Note the contrast between the inland areas and the coast, and the greater warming in summer, when temperatures are already hot.
Summary • Using a combination of dynamical and statistical downscaling techniques, we projected mid-21st century warming in the Los Angeles region at 2-km (1.2-mile) resolution for all available global models. • For the business-as-usual scenario, the most likely mid-century warming is roughly 4.6°F averaged over the region's land areas, with 95% confidence that the warming will lie between 1.7 and 7.5°F.
Summary • High elevations and inland areas warm 20 to 50% more than the areas near the coast or within the Los Angeles basin. This pattern is especially apparent in summertime. • Coastal locations and areas within the Los Angeles basin see roughly 2-3 times the number of extremely hot days, while high elevations and inland areas typically experience approximately 3-5 times the number of extremely hot days.
Summary • Under the mitigation emissions scenario, the majority of the warming seen in the business-as-usual scenario still occurs at all locations, and heat extremes still increase significantly. • Therefore adaptation to a changing climate in the Los Angeles region over the next few decades is very likely to be inevitable.
What is Next? • Over the next year we will be producing studies similar to the one presented here, quantifying changes in • precipitation and snowfall • Santa Ana wind strength, frequency & duration • stream flow, soil moisture & evaporation • low cloud (i.e “June Gloom”) Further information about the project is available at http://c-change.la/ The Los Angeles Regional Collaborative for Climate Action and Sustainability (LARC) http://www.environment.ucla.edu/larc/