Download
1 / 18
180 likes | 331 Views
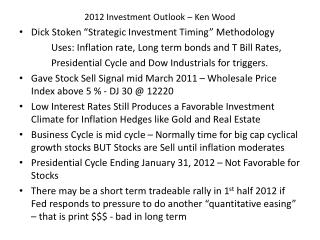
The 2012 NLTP Investment Outlook. Geoff Dangerfield, Chief Executive, 10 February 2011. The Planning & Investment System. Land Transport Expenditure – 2009/12 Est. total: $13.5 billion. National Land Transport Fund. Local Government Funding. 4590. State Highways. 1920. $m. 1760.

E N D
The 2012 NLTP Investment Outlook Geoff Dangerfield, Chief Executive, 10 February 2011
Land Transport Expenditure – 2009/12 Est. total: $13.5 billion National Land Transport Fund Local Government Funding 4590 State Highways 1920 $m 1760 Local Roads 900 Road Policing 870 720 Public Transport 1170 120 90 Community Programmes/Safety Crown Funding - Rail 100 Mgmt – Funding Allocation 100 20 Transport Planning 50 30 Walking & Cycling 50 Ministry of Tourism 00 00 Rail and Sea Freight
Land Transport Management Act Government Policy Statement Regional Strategies & Investment and Plans revenue strategy Regional Land National Land LTCCP’s & other Transport Transport local strategies Programmes Programme NLTF PLANNING & INVESTMENT Respective roles of the Minister, Local Government & NZTA - Minister/Ministry - Local Government - NZTA
Enhance transport efficiency and lower the cost of transportation through the following impacts: improvements in journey time reliability easing of severe congestion more efficient freight supply chains better use of existing transport capacity. better access to markets, employment and areas that contribute to economic growth a secure and resilient transport network. 2009 GOVERNMENT POLICY STATEMENTThe Investment ‘Brief’
2009 GPS FUNDING RANGESThe Investment Parameters Expected Expenditure on Transport Infrastructure - 2009/10 to 2011/12 (NZ$bn)
INVESTMENT DECISION-MAKINGThedecision criteria • Strategic fit • Alignment with the Government’s direction • Effectiveness • How well the project/package achieves the strategic outcomes Economic efficiency • Benefit cost ratio or cost effectiveness • High, Medium or Low assessment for each
STRATEGIC FITThe policy test The current ‘top’ priorities • RONS and local roads critical to RONS • Key freight and tourism routes • Key urban arterials • Model urban walking and cycling communities • Public transport making significant contributions to easing severe congestion • Optimising existing capacity and levels of service on highly trafficked roads
EFFICIENCYThe value test • For improvements the primary measure of economic efficiency is benefit cost ratio
STARTING POINTS (2)The forward commitments for 2012 and beyond • Most forecast revenue will be committed to maintaining and optimising what we’ve got and investing in planned improvements
STARTING POINTS (3)Key drivers for the 2012 NLTP • GPS 2012 • RLTS, RLTPs • Safer Journeys (and Road Safety Action Plans) • State highway classification • RONS programming • Auckland Spatial Plan • Public Transport – sector action plan • Freight efficiency – sector action plans
EMERGING THEMES (1)Sharpening our strategic intent • Clearer strategies and alignment of programmes • Focus on all components of our land transport networks • Better links between programmes and strategy
EMERGING THEMES (2)Lifting the efficiency equation • Greater optimisation • extracting maximum value from past/current investment • the optimal balance between maintenance and improvements • Increased focus on user perspectives • Better definition of the desired levels of service e.g. KiwiRAP • Basis for understanding network access charging
EMERGING THEMES (3)Lifting the effectiveness of our investments • Improved costing e.g. whole of life costing of programmes and projects • Sound land use and transport planning – assessing the need for future transport investment
IN CONCLUSIONThe challenge for us all • Maintaining and optimising what we’ve got • Meeting our forward commitments • Giving effect to Government and regional direction • Meeting transport user and ratepayer expectations • Optimising the above within flat-lined revenue 18