Download
1 / 25
250 likes | 388 Views
United States Climate. Alabama Annual Average Temperature. Data Source: http://www.wrcc.dri.edu/cgi-bin/divplot1_form.pl?0106. United States Climate. How does climate vary as we traverse the U.S. along 40°N?. United States Climate. Average Temperature Along 40° Lat

E N D
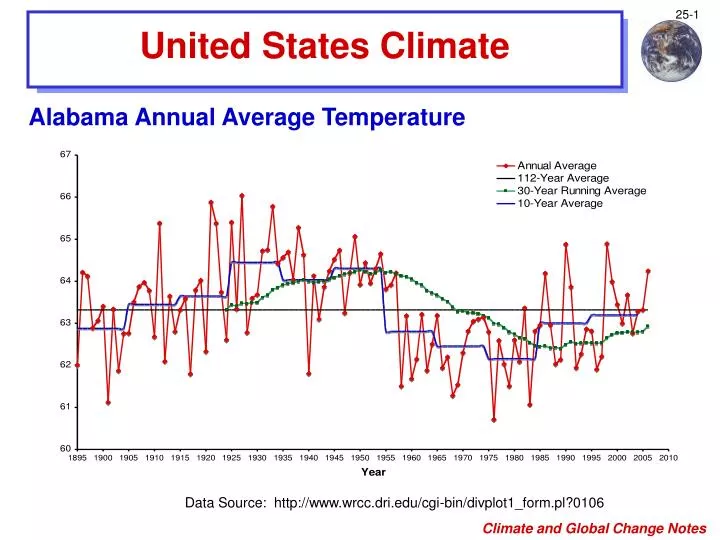
United States Climate Alabama Annual Average Temperature Data Source: http://www.wrcc.dri.edu/cgi-bin/divplot1_form.pl?0106
United States Climate How does climate vary as we traverse the U.S. along 40°N?
United States Climate Average Temperature Along 40° Lat • Atlantic City, NJ - Latitude = 39°27’N, Longitude = 74°35’W Elevation = 64 ft • Philadelphia, PA - Latitude = 39°53’N, Longitude = 75°15’W Elevation = 5 ft
United States Climate Average Temperature Along 40° Lat • Atlantic City, NJ - Latitude = 39°27’N, Longitude = 74°35’W Elevation = 64 ft • Kansas City, MO - Latitude = 39°7’N, Longitude = 94°36’W Elevation = 742 ft
United States Climate Average Temperature Along 40° Lat • Denver, CO - Latitude = 39°46’N, Longitude = 104°53’W Elevation = 5,283 ft • Kansas City, MO - Latitude = 39°7’N, Longitude = 94°36’W Elevation = 742 ft
United States Climate Average Temperature Along 40° Lat • Denver, CO - Latitude = 39°46’N, Longitude = 104°53’W Elevation = 5,283 ft • Fraser, CO - Latitude = 39°50’N, Longitude = 105°50’W Elevation = 8,550 ft
United States Climate Average Temperature Along 40° Lat • Denver, CO - Latitude = 39°46’N, Longitude = 104°53’W Elevation = 5,283 ft • Salt Lake City, UT - Latitude = 40°46’N, Longitude = 111°58’W Elevation = 4,220 ft
United States Climate Average Temperature Along 40° Lat • Atlantic City, NJ - Latitude = 39°27’N, Longitude = 74°35’W Elevation = 64 ft • San Francisco, CA - Latitude = 37°37’N, Longitude = 122°23’W Elevation = 8 ft The coldest winter I ever spent was a summer in San Francisco. Mark Twain
United States Climate Mean Monthly Accumulated Precipitation Along 40° Lat
United States Climate Mean Monthly Accumulated Precipitation Along 40° Lat
United States Climate Mean Monthly Accumulated Precipitation Along 40° Lat
United States Climate How does climate vary with north-south latitude?
United States Climate Average Temperature Comparison to Huntsville • Kansas City, MO - Latitude = 39°7’N, Longitude = 94°36’W Elevation = 742 ft • Huntsville, AL - Latitude = 34°39’N, Longitude = 86°46’W Elevation = 624 ft
United States Climate Average Temperature Comparison to Huntsville • Philadelphia, PA - Latitude = 39°53’N, Longitude = 75°15’W Elevation = 5 ft • Huntsville, AL - Latitude = 34°39’N, Longitude = 86°46’W Elevation = 624 ft
United States Climate Mean Monthly Accumulated Precipitation
United States Climate Mean Monthly Accumulated Precipitation
United States Climate Mean Monthly Accumulated Precipitation
United States Climate Mean Monthly Accumulated Precipitation
United States Climate Mean Accumulated Precipitation July January http://www5.ncdc.noaa.gov/cgi-bin/climaps/ climaps.pl?directive=welcome&subrnum= Annual
Hawaiian Islands Climate http://www.bestofhawaii.com/map_bigi.htm Hawaiian Islands • Downtown Honolulu (1) the warmest month is August, with an average temperature of ~78F the coldest, February, ~72F 20.75 in precipitation • Annual rainfall averages range - 20 inches and less in leeward coastal areas and near the summits of the very high mountains, Mauna Loa (2) and Mauna Kea (3) on Hawaii - Excess of 300 inches along the lower windward slopes - Mt. Waialeale on Kauai (4), the annual average reaches 486 inches – over 40 ft. This is the highest recorded annual average in the world. • Ocean (5) annual precipitation, i.e., no islands ~25” 5 4 1 3 2 http://www.wrcc.dri.edu/narratives/HAWAII.htm
Hawaiian Islands Climate Hawaiian Islands • Mean annual precipitation (in) • Mean annual temperature (°F) Northeast Trade Winds http://www5.ncdc.noaa.gov/cgi-bin/climaps/ climaps.pl?directive=welcome&subrnum=
Hawaiian Islands Climate Honolulu WSO Airport • 21° 20’ N, 157° 55’ W • Elevation = 10 ft • Averages for 10/1/49-3/31/05 Ave. Max. Temp. = 84.0°F Ave. Min. Temp. = 70.2°F Ave. Annual Precipitation = 20.75 in http://www.wrcc.dri.edu/cgi-bin/ cliMAIN.pl?hihono
Hawaiian Islands Climate Kainaliu • 19° 32’ N, 155°56’ W • Elevation = 1,500 ft • Averages for 10/1/49-3/31/05 Ave. Max. Temp. = 77.9°F Ave. Min. Temp. = 61.3°F Ave. Annual Precipitation = 63.39 in http://www.wrcc.dri.edu/cgi-bin/ cliMAIN.pl?hikain
Hawaiian Islands Climate Kulani Camp • 19° 33’ N, 155°18’ W • Elevation = 5,170 ft • Averages for 10/1/49-3/31/05 Ave. Max. Temp. = 63.7°F Ave. Min. Temp. = 47.0°F Ave. Annual Precipitation = 106.95 in http://www.wrcc.dri.edu/cgi-bin/ cliMAIN.pl?hikula
World Climate - Growth Limitations Climate Limitations • Map shows which of three key climate factors limits plant growth in an area (red is water; green is sunlight; blue is temperature) • High northern latitudes are limited by temperature • Areas along the fringe of Africa’s Sahara Desert are limited by water • Across the tropics, regular cloudiness limits plant growth • In many places, these factors are co-limiting, i.e., more than one climate factor is limiting plant growth http://earthobservatory.nasa.gov/Study/GlobalGarden/