Download
1 / 28
280 likes | 426 Views
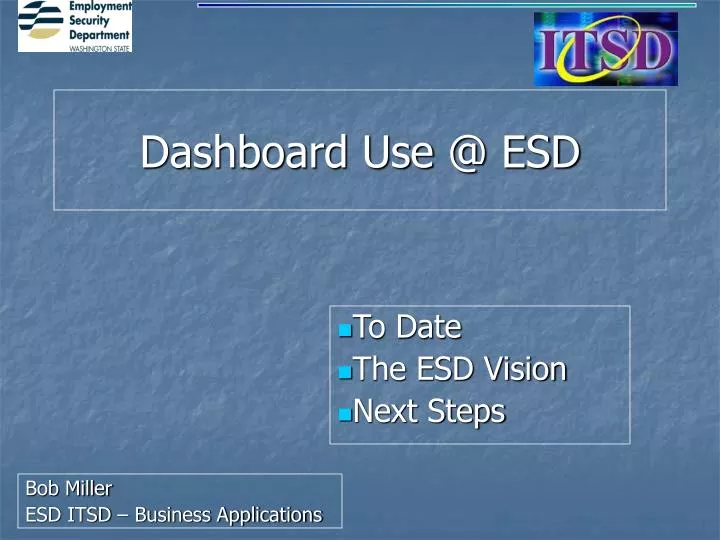
Dashboard Use @ ESD. To Date The ESD Vision Next Steps. Bob Miller ESD ITSD – Business Applications. GMAP Dashboards. E-Dashboards. With Drilldown. WHY. FEDERAL Department of Labor Set us on the road to. a performance based culture. GMAP “Deliverables”.

E N D
Dashboard Use @ ESD To Date The ESD Vision Next Steps Bob Miller ESD ITSD – Business Applications
GMAP Dashboards E-Dashboards With Drilldown
WHY FEDERAL Department of Labor Set us on the road to a performance based culture.
GMAP “Deliverables” • SLT to Commissioner “Web Site” • Commissioner to Gov “Web Site” • Public Web Site • Drill Down to Desktop = Mgmt Dashboard
GMAP Dancing To Date • Weekly by Division • Manual (Somewhat) • Collection • Presentation • Analysis • Healthy Data Warehouse • Already Exists
COLLECTION NEEDED AFRS Budget AFRS A/R Telecenters HRMS AFRS TAXIS UI Benefits WorkFirst DIS Charges DW (MS) SKIES SKIES SKIES HISTORY Financial JobNET JTPA WIA TeleCenters Transaction Systems ETL SKIES DW (Oracle) SKIES SKIES ETL
PRESENTATION Speak!
TeleCenter Call Monitoring ANALYSIS • Purpose: • To measure the quality of customer interactions with TeleCenter agents • Target: • Process owner: • Rosie Macs, TeleCenter Operations • Outcome • 87.8% last 3 months passed (361 of 411). • How this measure contributes to our strategic goals • provides agents feedback regarding accuracy; identify training needs • provides agents feedback regarding quality of service given • provides quantifiable information that contributes to performance evaluations • Improvement strategies • Acquiring call monitoring software would: • enhance the perception of fairness and objectivity • be a more effective means of providing feedback • allow identification of computer input errors • Approx. Cost = $300K
PRESENTATION = 80% to 89% to Target Job Seekers Employed Region 3: Northwest WA % to Target = 80% Region 4: Snohomish Co. % to Target= 95% Region 1: Olympic Consortium % to Target = 93% Region 5: Seattle / King Co. % to Target = 95% Region 6: Pierce Co % to Target = 72% Region 2: Pacific Mountain % to Target = 85% Region 7: Southwest WA % to Target = 78% Region 8: N. Central WA % to Target = 96% Region 10: Eastern WA. Part. % to Target = 76% Region 12: Spokane % to Target = 88% Region 9: % to Target = 101% Region 11: Benton-Franklin % to Target = 94% Whatcom Pend Pend Okanogan 03 Oreille Oreille San Juan Okanogan Skagit Ferry Ferry Stevens Island Stevens 08 Snohomish Snohomish Clallam Clallam 04 10 01 12 Chelan Chelan Jefferson Jefferson Douglas Douglas King Kitsap Kitsap King Lincoln Lincoln Mason Spokane 05 Grays Grant Mason Kittitas Harbor Grays Grant Kittitas Pierce Harbor Pierce Adams Adams Whitman Whitman 02 06 Thurston Thurston 09 Pacific Franklin Franklin Lewis Lewis Pacific Garfield Garfield Yakima 11 Yakima Cowlitz Walla Walla Cowlitz Benton Benton Skamania Skamania Wahkiakum Wahkiakum Walla Walla Asotin Asotin 07 Klickitat Columbia Columbia Klickitat Clark Clark Statewide: 88% to Target Source: UI Wage & New Hire Data = 79% or below Target = 90% to 99 % Target = At Target
ANALYSIS July 2005 Time to Work • State Target for PY 04-05: • (Rational for setting target: a 5% • decrease from the median numbers • of days for last complete year of • data) • 87 median days • Analysis: • Jul. 05 preliminary estimate is 95 days to employment. • Reflects 8 days off target. • Actions: • Improve the job seeker registration process (i.e.: add desired employment information) • Focus staff resources to assist in better job matching and reduce generic job search activities. • Focus on providing job referrals to staff assisted job seekers * The number in the target row represents the proposed targets and may not be final. **July data is based on a rolling 12 month average.
Auditioning Dashboarders . . .with State Participation COWABUNGA DUDE!
GMAP Dashboards E-Dashboards With Drilldown
Bob Miller - BBMiller@esd.wa.gov • Bob Bartusch - BBartusch@esd.wa.gov