Download
1 / 41
420 likes | 623 Views
Quaternary modelling case studies. Last Glacial Inception : ~115kyrBP Last Glacial Maximum : ~21kyrBP The mid-Holocene : ~6kyrBP. Mid-Holocene, 6kyrBP. Glacial Inception, 115kyrBP. Last Glacial Maximum, 21kyrBP. Petit et al, Nature, 399, 429-436, 1999.

E N D
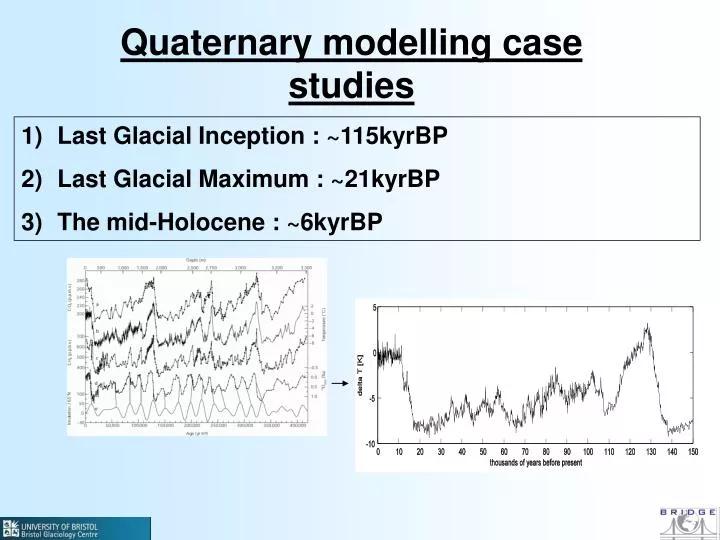
Quaternary modelling case studies Last Glacial Inception : ~115kyrBP Last Glacial Maximum : ~21kyrBP The mid-Holocene : ~6kyrBP
Mid-Holocene, 6kyrBP Glacial Inception, 115kyrBP Last Glacial Maximum, 21kyrBP Petit et al, Nature, 399, 429-436, 1999. • Focus on 3 important periods in the last 150,000 years.
1) Last Glacial Inception Glacial Inception, 115kyrBP • End of the last interglacial. Initiation of large ice-sheets.
Northern and Southern hemisphere ice-sheet volume similar to present. • CO2 similar to pre-industrial modern. • Difference: ORBIT! • Higher eccentricity and lower obliquity than present, but perihelion unchanged => cooler NH summers! Vettoretti and Peltier, 2004
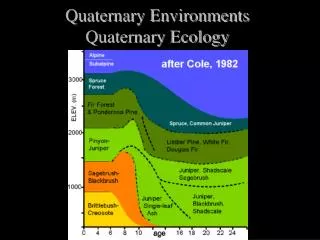
Caused by build-up of snow which survives the summer. • Geological evidence points to inception on Queen Elizabeth Islands and Baffin Islands. Elevation [metres] See Clark et al, Quaternary Science Reviews, 12, 79-114, 1993.
First modelling studies in 80’s fail to simulate inception. • Mid-90’s, first successful inception experiment. • Ocean temperature changes, accuracy of model’s present-day climate both important. Dong and Valdes, Journal of Climate, 8, 2471-2496, 1995.
Khodri et al, 2001 • Ocean circulation changes also important.
Vegetation changes also important. • Boreal forest/tundra – snow - albedo feedback. Snowy Forest: low albedo Snowy Tundra: high albedo See also de Noblet et al, Geophysical Research Letters, 23, 3191-3194, 1996, Dorman & Sellers 1989
Kubatzki et al, 2006 Kubatzki et al, Climate Dynamics (2006) 27: 333–344 • More recent work includes fully dynamic ice sheet models….but relatively simple EMICs….. Transient simulations
Archer and Ganopolski, ‘A movable trigger: Fossil fuel CO2 and the onset of the next glaciation’ See also Loutre, 2002, ‘An Exceptionally Long Interglacial Ahead?’ Also papers by Mysak.
Last Glacial Maximum, 21kyrBP Last Glacial Maximum, 21kyrBP • Largest mass of land-ice in the last 130,000 years.
Last Glacial Maximum, 21kyrBP • Incoming solar radiation distribution very similar to present. • CO2 at approx 185ppmv ( pre-industrial 280ppmv, present approx 380ppmv (and rising!)).
Last Glacial Maximum, 21kyrBP • Observations: global ice-sheet area reconstruction, derived from position of glacial morraines. Modern [fraction] LGM Peltier, Science, 265, 195-201, 1994.
Last Glacial Maximum, 21kyrBP • Observations: global topographic reconstruction, derived from observed rebound of lithosphere. Modern [metres] LGM Peltier, Science, 265, 195-201, 1994.
ICE-4G ICE-5G Kageyama et al, 2006
Last Glacial Maximum, 21kyrBP • Observations: global sea-surface temperature: CLIMAP. Derived from bugs, e.g. foraminifera, in ocean sediments. December SST, oC LGM-present CLIMAP project members, Map and chart ser. MC-36, 1981. For updated version see also Hostetler and Mix, Nature, 399, 673-676, 1999. Also, newer MARGO data.
Last Glacial Maximum, 21kyrBP CLIMAP project members, Map and chart ser. MC-36, 1981. • Observations: global sea-ice extent: CLIMAP, again from ocean sediments. December Modern [fraction] LGM
Last Glacial Maximum, 21kyrBP • Observations: terrestrial pollen data. Kageyama et al, Climate Dynamics, 17, 23-43, 2001
Last Glacial Maximum, 21kyrBP • History of LGM modelling • GCMs with constrained (CLIMAP) SSTs and sea-ice extent, constrained (Peltier ICE4G icesheets), constrained CO2. (PMIP). • GCMs with simple ocean (thermodynamic, not dynamic) and seaice, constrained (Peltier ICE4G icesheets), constrained CO2. • GCMs with fully-dynamic ocean and seaice and vegetation, constrained (Peltier ICE5G icesheets), constrained CO2. (PMIP2). PMIP2 website: http://www-lsce.cea.fr/pmip2/ PMIP1 website: http://www-lsce.cea.fr/pmip/
Last Glacial Maximum, 21kyrBP Hadley centre model results, fixed SSTs, seaice extent. Annual mean, surface temp change, LGM-present day. July, surface wind strength, LGM. Jost et al, Climate Dynamics, 2005.
Last Glacial Maximum, 21kyrBP Hadley-centre model (and others) too warm over Europe! Models are not sensitive enough to the imposed boundary conditions. Fixed SSTs, seaice. Hadley-Centre model, 96x72. Jost et al, Climate Dynamics, 2005.
Last Glacial Maximum, 21kyrBP • PMIP1 models. • All models are too warm relative to present in western Europe at the LGM. • Why? • Inherent model flaws? • Resolution? • Boundary conditions? • Data is wrong?! Kageyama et al, Climate Dynamics, 17, 23-43, 2001
Last Glacial Maximum, 21kyrBP Fixed SSTs, seaice. Hadley-Centre REGIONAL model. Very high resolution over Europe. Regional model much better representation of temperature. Jost et al, Climate Dynamics, 2005.
Effect of including vegetation changes in the GCM Ramstein et al, Clim. Past, 3, 331–339, 2007
Effect of including CO2 effects on vegetation… Clim. Past, 3, 331–339, 2007
Last Glacial Maximum, 21kyrBP Dynamic ocean and seaice Was part of the North Atlantic warmer than present?! Hewitt et al, Climate Dynamics, 20,203-218, 2003
Ensemble does not support warm Atlantic • Relative importance of forcings IPCC AR4, Paleoclimate Chapter
Difference between fully coupled (AO), slab, or fixed SSTs… Bracconnot et al, 2007, Clim Past
Comparison with data IPCC AR4, Paleoclimate Chapter
Downscaling… Vrac et al, 2007
The mid-Holocene, 6kyrBP Mid-Holocene, 6kyrBP • Period of relative warmth.
Why study 6k? IPCC AR4, Paleoclimate Chapter
The mid-Holocene, 6kyrBP • Relatively large northern-hemisphere summer insolation (larger obliquity and eccentricity and change in perihelion) • CO2 at approx pre-industrial - 280ppmv.
Difference between fully coupled (AO) or fixed SSTs… Bracconnot et al, 2007, Clim Past
The mid-Holocene, 6kyrBP BIOME 6000: Prentice et al. (2000) Harrison et al. (2001) Bigelow et al. (2003) http://www.bridge.bris.ac.uk/resources/BIOMES_data/BIOME_v4.2.htm Tropical forest Warm-temperate forest Savanna and dry woodland Grassland and dry shrubland Desert Temperate forest Boreal forest Tundra Dry tundra • Pollen data, cave paintings: A vegetated Sahara!
The mid-Holocene, 6kyrBP • Intensification of the Asian and African Monsoons JJA precipitation change, mm/day,6kyrBP-preindustrial • However, coupled climate-vegetation models currently unable to generate a green Sahara – not sensitive enough. See also, Texier et al, Journal of Climate, 13, 164-181, 2000.
The ‘Green Sahara’ problem….. still a problem Bracconnot et al, 2007, Clim Past
Quaternary modelling case studies • Modelling improving due to inclusion of additional processes, but current state of the art models as yet untested….(see PMIP3!) • Many problems still remain, e.g. Green Sahara at 6k, cold Western European temps at 21k, not to mention carbon cycle! • Hierarchy of models can be used to address different problems…but ultimate test must be with GCMs