Download
1 / 17
300 likes | 688 Views
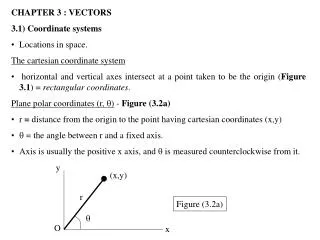
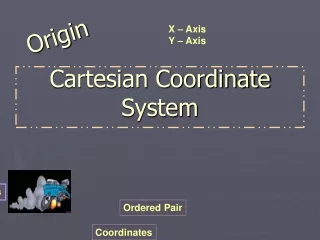
Cartesian Coordinate System. Making a Graph!. Ordered Pair ( x,y ) ( right or left, up or down) (4,2) (-3,3) (-4,-1) (3,-2). Coordinate Plane (Title) x-axis y-axis Quadrant I Quadrant II Quadrant III Quadrant IV (+,+) (+,-) (-,+) (-,-) Origin (0,0).

E N D
Making a Graph! • Ordered Pair (x,y) • (right or left, up or down) • (4,2) • (-3,3) • (-4,-1) • (3,-2) • Coordinate Plane (Title) • x-axis • y-axis • Quadrant I • Quadrant II • Quadrant III • Quadrant IV • (+,+) • (+,-) • (-,+) • (-,-) • Origin • (0,0)
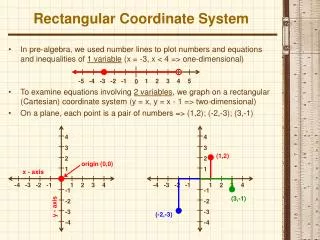
Cartesian coordinate system • Is used to graph relationships between quantities • Composed of x-axis and y-axis
Ordered pairs • Written as (x, y) or (x, f(x)) • Can be located in any quadrant or on the x- or y –axis • Another way to write y is f(x)
Domain • The set of x values • The notation is written such as D:{-2, 0, 2} • Can be either continuous or discrete
Discrete • Individual points that would not be connected when graphed because not all rational values define the domain • Discrete data represented by the graph of a function are connected with a broken line on the graph • Example: Miles and Intersections Scatterplot
Continuous • An infinite number of points that are connected when graphed because all real values can be defined in the domain • Connected with a solid line on a graph • Written using inequality notation such as D:{-5< x< 7} • Example: Burning Calories Graph #4
Range • Is the set of y values • Notation is written using inequality notation such as R: {-5< y< 7} or R: {y > 0}
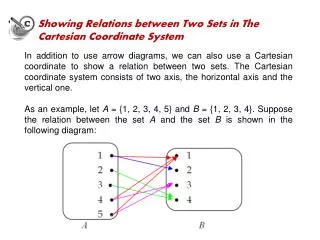
Functions • Relations in which each element of the domain is paired with exactly on element of the range • Each x value is paired with a unique y value, the x’s DO NOT repeat • A vertical line will cross the graph of the data in only one point on a graph
Functions • If the y value increases as the x value increases, the function is increasing • On graph – will go up from left to right • If the y value decreases as the x value decreases, the function is decreasing • On graph – will go down from left to right
Connections • In Miles and Intersections is there a relation between miles to school and intersections crossed? Why or why not? • Yes, the data in the table can be written as ordered pairs (miles, intersections) and graphed on a coordinated plane
In Burning Calories is there a relation between kilocalories burned and minutes? Why or why not? • Yes, the data in the table can be written as ordered pairs (number of kcal, number of minutes) and graphed on a coordinated plane
Relation and dependence both describe how two quantities can be connected. How are the two ideas different? • Two quantities can be related without being dependent on the other • Ex: Miles and Intersection
The number of minutes depends on the number of kcal. When calculating the number of minutes, changing the number of kcal changed the answer. Did the number of intersections depend on the distance? Why or why not? • No. The distance didn’t affect the number of intersections.
Identify the independent and dependent variable in the activity Burning Calories? • Independent: kilocalories Dependent: minutes • Identify the independent and dependent variable in the activity Miles and Intersections? • Independent: miles Dependent: intersections • Give another example of a situation where one quantity depends on another????
Does Burning Calories represent a continuous or discrete domain? Explain • The domain is continuous, because it could be any real value including fractions and decimals • What is the domain and range of the relation investigated in Burning Calories? • D: {x ≥ 0} R: {y ≥ 0} • Is the relation in Burning Calories increasing or decreasing? • Burning Calories is an increasing functional relationship. As the x value increases the y value increase.
Let’s go back to our Cartesian Plane!!!!!!! NOW ADD INDEPENDENT, DEPENDENT, DOMAIN AND RANGE !!!