Download
1 / 15
150 likes | 233 Views
Multigenerational Analysis And Visualization of Large 3D Vascular Images. Shu-Yen Wan Department of Information Management, Chang Gung University, Taiwan, R.O.C. Erik L. Ritman Department of Physiology, Mayo Clinic Foundation, USA William Higgins

E N D
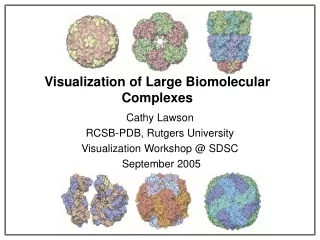
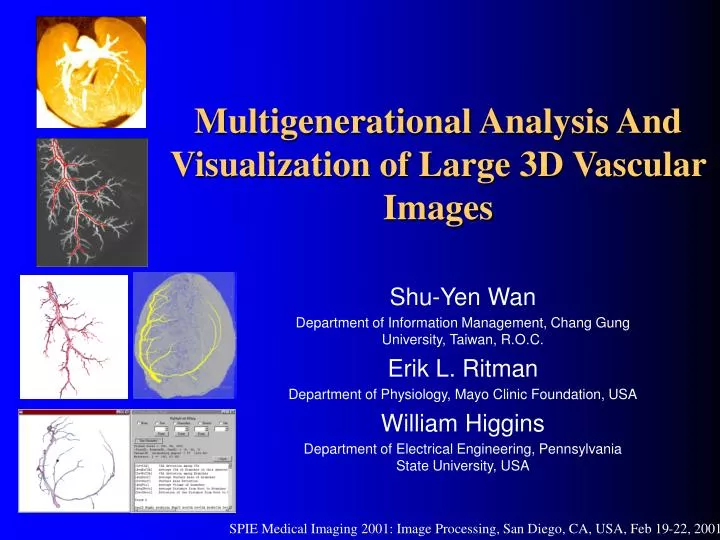
Multigenerational Analysis And Visualization of Large 3D Vascular Images Shu-Yen Wan Department of Information Management, Chang Gung University, Taiwan, R.O.C. Erik L. Ritman Department of Physiology, Mayo Clinic Foundation, USA William Higgins Department of Electrical Engineering, Pennsylvania State University, USA SPIE Medical Imaging 2001: Image Processing, San Diego, CA, USA, Feb 19-22, 2001
Problem Statement Extract embedded geometrical information in large 3D medical images containing vascular networks to perform physiological studies and identify the abnormal. Analysis • Branching Geometric Information • Retrieval of Analysis Statistics • Vasculature manipulation • Guided Navigation for Education and Surgery visualization
Challenges • Control1 • Size: 80.2 MB (16-bit) • Subject: rat liver, bile ducts • Dimensions: 399215491 • Voxel resolution: x=y=z=21m • Manual analysis is time-consuming • Automatic analysis requires considerable • storage & processing space • computation • Efficient network representation is critical • Root identification • 3D Visualization to interact with extracted information • Control2 • Size: 114.4 MB (16-bit) • Subject: rat liver, bile ducts • Dimensions: 400400375 • Voxel resolution: x=y=z=21m • Control3 • Size: 73 MB (16-bit) • Subject: rat liver, bile ducts • Dimensions: 319247487 • Voxel resolution: x=y=z=21m
Specific Aims • Devise efficient individual algorithms and integrated analysis procedure for large 3D branching networks. • Construct visualization tools to interact with the extracted image information. • Validation.
Extraction of Regions of Interest 3D Sigma Filter 3D Symmetric Region Growing Segmentation 3D Cavity Deletion Extracted Trees Vasculature Representation and Analysis • 3D Thinning Vasculature Representation Measurement Calculation Root Identification Pruning Analysis Procedure for 3D Vascular Images
Generational Analysis of Control1 Generational Analysis of Control1
More analysis not shown Branching Analysis of Control1 – an excerpt Branching Analysis of Control1
Variation of Branch Diameters vs. Cumulative Lengths L = cDb
Volume Loss Analysis 1-(D3d1/D3m+D3d2/D3m) = a
Problems With Traditional Image Viewing • Only Two-Dimensional Views • Restricted Viewing Directions • Can’t Retrieve Extracted and Computed Geometrical Information • Lack of Global Views of the Vasculature
Visualization of Geometrical Information • Determine intensity range of regions of interest • Estimate root location of the branching structure • Display quantitative analysis results • Dynamically interact with the extracted vasculature • 3D Viewers • 3D Slicer Tools • 3D-to-2D Projection Tools • 3D Tree Tool
2D Slicer Tools 3D Viewer histogram equalization color table selection point of selection and its gray-level value color table entry# 0 color table entry# 255 3D-2D Projection Tools
Summary and Future Work • 3D image processing and analysis procedure • Perform comprehensive generational analysis on networks contained in 3D images • Visualization tools • Offer global view of extracted branching structures • Display branching geometric information • Interactively edits of the branching structures • Java implementation of the analysis system • Studies on Medical Education and Image-Guided Surgery • Improvements on the 3D Rendering Tools.
Thank You! Thank you !