Download
1 / 20
200 likes | 294 Views
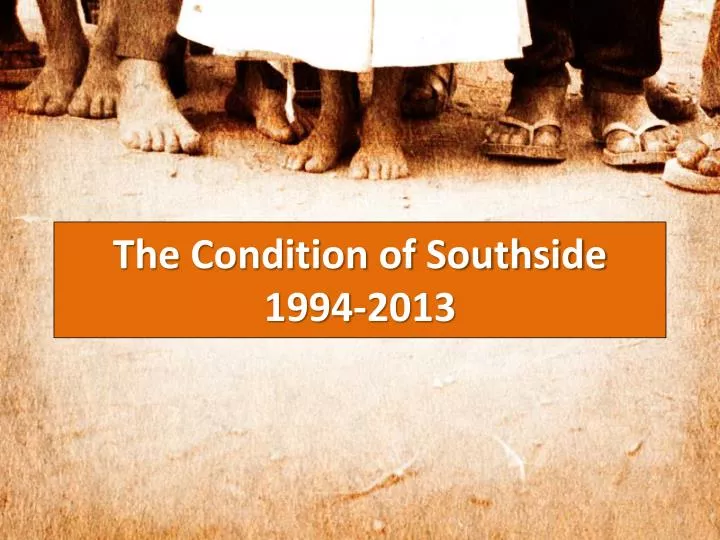
The Condition of Southside 1994-2013. Membership. Understanding the Charts. Membership has grown from 765 in 1994 851 in 2013 86 members Average growth over this period is 4.5 members per year ; however the true growth is from 2004 to 2013 with an average of 9.5 members per year .

E N D
Understanding the Charts Membership has grown from 765 in 1994 851 in 2013 86 members Average growth over this period is 4.5 members per year ; however the true growth is from 2004 to 2013 with an average of 9.5 members per year
Service Attendance 2004-2013 1st Service 2nd Service
Understanding the Charts Morning Services From 1994-2013 -Total attendance has grown over this period from 161 to 195 - However we saw a decline start in 1997, level out in 1999, and flat line until 2004 when we started growing again.
Understanding the Charts From 2004-2013 1st Service Grew from 41 to 73 Growth of 32 individuals 2nd Service Grew from 120 to 122 Growth of 2 individuals
Understanding the Charts Sunday School From 1994-2013 Growth from 1994-1998 then a downward trend from 161 in 1998 to 120 in 2001. We started growing again in 2004 to plateau at 143 in 2008.
Understanding the Charts Baptisms 1994-2013 Total of 199 baptisms on record per the ACP (Annual Church Profile). From 2004-2013 a total of 92 Average Baptisms per year of 11.2
Understanding the Charts Budget 1994-2013 1994 - $182,418.00 2013 - $396,778.00 In 19 years an increase of $214,360.00 = 117% Last 5 years (2008-2013) an increase of $100,334. Almost ½ of the increase!
Remodeling Since the early 1980’s… Remodeled the Sanctuary, Fellowship Hall and all three levels of the Educational Building. All remodels have improved appearance, functionality and comfort of our facilities for our membership. Sanctuary seating was reduced with the addition of the sound booth. Education space was reduced with the remodeling of the fellowship hall and all three levels of the education building.
Ten Thumb Rules for Healthy Church • Number of acres needed for church site: one acre for every 125 in attendance • Parking spaces: one space for every 2 people in attendance • Parking area: 100 spaces for every acre used for parking • Evangelistic effectiveness: 12 conversions per year for every 100 in average attendance.
Ten Thumb Rules for Healthy Church (cont.) • Seating space per attendee: 27 inches • Maximum capacity of a facility: 80 % full. When a facility is 80% full architecturally, it feels 100% full. • Retention effectiveness: For every 10 new members added per year, average worship attendance should increase by 7. • Effective giving: For every person in attendance, $26.00 in budget receipts
Ten Thumb Rules for Healthy Church (cont.) • Maximum debt payment budgeted: 33% of annual income for most churches • Maximum debt owed: 2.5 times the annual income for the previous year
Desirable Facility Functions • Sanctuary seating for 500 members (based on attendance of 342 last Easter) • Fellowship hall seating for 400 members (Multi-Purpose Facility) • Full functioning kitchen • Education space to allow large and small group settings • Parking for 200 vehicles (currently have parking for 97) • Welcome and Information center • Music center
Desirable Facility Functions (cont.) • Baptistery • Elevator (multi-floor facility) • Technology center • Staff offices • Storage • Restrooms • Community support with Disaster Relief
Options for Growth • Stay Here - Build Here • Buy Land – Build There • Buy Suitable Existing Facility- Modify to our Needs • Establish a Mission