Download

1 / 20
210 likes | 388 Views
School-Level Data Dive. LEADING WITH DATA. School-Level Data Dive Outcomes. Reflect on the power of leading with data to drive rigorous instruction for all students. Explore research on Howard County student outcomes that supports a pathway to college and career readiness.

E N D
School-Level Data Dive LEADING WITH DATA
School-Level Data Dive Outcomes Reflect on the power of leading with data to drive rigorous instruction for all students Explore research on Howard County student outcomes that supports a pathway to college and career readiness Deepen a skill set for analyzing data to drive rigorous instruction
Making Connections:Understanding Research-based Trends • HCPSS students who took at least 1 AP course by grade 11 were 2 times more likely to be college ready and enroll in college immediately following high school. • HCPSS students who achieved a PSAT ≥ 145 in Grade 10 were 13 times more likely to be college ready and enroll in college immediately following high school. • Students who took Algebra 2 by Grade 11 were 3 times more likely to be college ready and enroll in college immediately following high school.
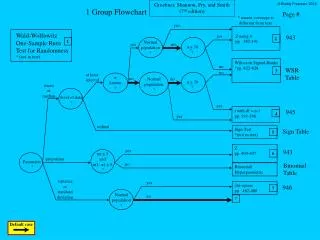
Making Connections: Math Progression Gr. 12 AP Calculus AB Gr. 11 Pre-Calculus Gr. 10 Algebra 2 Gr. 9 Geometry Gr.8 Algebra 1 Gr. 7 CC 8 Gr. 6 CC 7 Gr. 5 Above (CC6)
Making Connections: ES, MS, HS Across levels, we are looking to build an academic profile of students who meet Preliminary Performance Benchmarks (PPB) and using this information to driverigorous instructionfor all students.
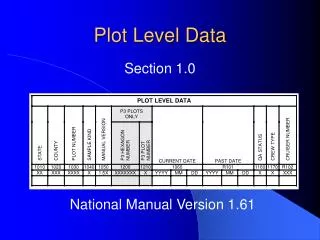
Analyzing/Interpreting Data Beginning with School-Level Data
OPEN EXPLORATION:Orienting to the School-Level Data Description of the Dataset • At least 3 years of data • Data is reported by student groups • Note the sheets/tabs at the bottom Dataset Codebook • School-level Data Reference Guide
OPEN EXPLORATION:Orienting to the School-Level Data Activity 15 minutes (be prepared to share at your table) Pick a tab to explore • What trends do you notice? • How are these trends changing? • Or not changing? • What surprised you? • What might you want to explore further? • What other data would be helpful?
Analyzing/Interpreting School-Level Data We know: Students who achieved a PSAT ≥ 145 in Grade 10 were 13 times more likely to be college ready and enroll in college immediately following high school. Question: What proportion of students meet this PPB at my school? How does this vary by student groups?
Analyzing/Interpreting School-Level Data • Go to PSAT - Grade 10 tab • Filter for “All Students” in Groups What is the trend in the % of students with PSAT ≥ 145? How has your student population grown or changed in the 3 year period? 3. Now filter for 2014 only, and look at your data by student groups. What is the trend in the % of students with PSAT ≥ 145? 4. Now go to AP Exams tab 5. Filter for “CalculusAB”, “Calculus BC”, and “Statistics” in Exams How many students are taking the Calculus AB AP exam in your school in each year; how is it trending?
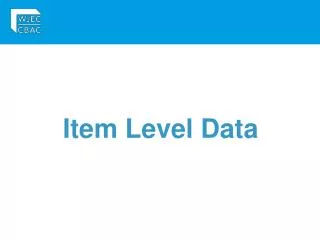
Analyzing/Interpreting Data Diving into Student-Level Data
From School- to Student-Level Data • School-level data are your back story/context • Student-level data are your actionable data
OPEN EXPLORATION:Orienting to the Student-Level Data Description of the Dataset • SY 2014 Grade 10 students • Current and prior years’ data for these students • Each line represents one student Dataset Codebook • Student-level Data Reference Guide Activity 5 minutes • Explore the variables • Use your filters, freeze the top row • Keep track of your ‘n’ in the bottom left corner • When you filter on one variable, notice that the values in the filter for other variables are also filtered
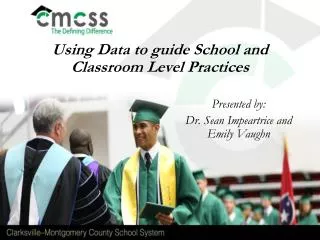
Analyzing/Interpreting Student-LevelData We know: HCPSS students who took at least 1 AP course by grade 11 were 2 times more likely to enroll in college. AP scores were not a significant predictor of college enrollment. Questions: (1) What processes are in place to ensure that students who are AP Potential in Grade 10 enroll in an AP course by Grade 12? (2) How can understanding the academic profile of the students who meet this PBB help drive rigorous instruction for all students?
Analyzing/Interpreting Student-Level Data • Filter for students who have PSAT Math ≥ 63 (70% likely to get a 3 or higher on AP Calculus AB Exam) Dig deeper: What proportion of these students took Alg. 1 by Grade 8? Describe them: What academic level courses did they take in Grade 9, 10? Are any students in Geometry in Grade 10 (OGL)? Reflect: (1) Should there be any students with PSAT ≥ 63 (AP Potential) and in OGL Math in Grade 10? (2)Will all students at my school with PSAT ≥ 63 be recommended for an AP Math course in Grade 11?
Analyzing/Interpreting Student-Level Data We know: Students who took Algebra 2 by Grade 11 were 3 times more likely to be college ready and enroll in college immediately following high school. Questions: • What options should these students consider at the critical decision point that follows Alg.2? What processes are in place to support them? • How can understanding the academic profile of the students who meet this PBB help drive rigorous instruction for all students?
Analyzing/Interpreting Student-LevelData 2. Filter for students taking Algebra 2 in Grade 10 Dig deeper: Of these students, what proportion: • Had an ‘A’ or ‘B’ in their Grade 9 Math course? • Have a GPA > [threshold]? • Have a PSAT Math score > [threshold]? Describe them: Race/ethnicity, student service groups Reflect: (1) What options should they consider after Alg.2? What supports do they need in Grade 11 to reach AP Statistics, AP Calculus or Calculus GT by Grade 12? (2) How can Grade 9 teachers use the academic profiles of these students to ensure rigorous instruction OGL? To ‘talent spot’ students with similar academic profiles?
Analyzing/Interpreting Student-LevelData 3. Filter for students taking Geometry in Grade 10 (On Grade Level) and final grade “A” or “B” in Grade 9 Math course) Dig deeper: Of these students, what proportion: • Were Proficient/Advanced on MSA Math? • Took Algebra 1 by Grade 8? • Have a GPA > [threshold]? Describe them: What is the range of their PSAT Math scores? [sort highest to lowest] Reflect: (1) What supports do they need to take one (or more) of the following in Grade 12: Trigonometry, Math Analysis, AP Statistics? (2) How can Grade 9 teachers use the academic profile of these students to ‘talent spot’ students with similar academic profiles in their own classroom?
Connecting the Data to Rigorous Instruction TABLE TALK How will you use this data exercise, the Preliminary Performance Benchmarks, and other resources to support college readiness to lead with data?