Download
1 / 3
30 likes | 167 Views
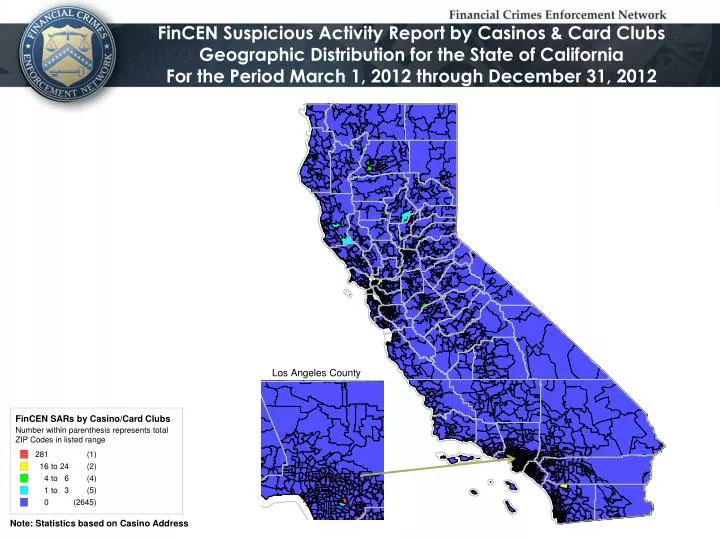
281. (1). 16. to. 24. (2). 4. to. 6. (4). 1. to. 3. (5). 0. (2645). FinCEN Suspicious Activity Report by Casinos & Card Clubs Geographic Distribution for the State of California For the Period March 1, 2012 through December 31, 2012. Los Angeles County.

E N D
281 (1) 16 to 24 (2) 4 to 6 (4) 1 to 3 (5) 0 (2645) FinCEN Suspicious Activity Report by Casinos & Card Clubs Geographic Distribution for the State of California For the Period March 1, 2012 through December 31, 2012 Los Angeles County FinCEN SARs by Casino/Card Clubs Number within parenthesis represents total ZIP Codes in listed range Note: Statistics based on Casino Address
FinCEN SARs by Casino/Card Clubs Number within parenthesis represents total ZIP Codes in listed range 579 to 903 (2) 100 to 578 (2) 10 to 99 (24) 2 to 9 (35) 0 to 1 (2594) FinCEN Suspicious Activity Report by Casinos & Card Clubs Geographic Distribution for the State of California For the Period January 1, 2013 through December 31, 2013 Santa Clara County Los Angeles County Note: Statistics based on Casino Address
Added Value Summary Report Spreadsheets For the State of California For Calendar Years 2012 and 2013 Filings by County Filings by Metropolitan Statistical Area Characterizations by Suspicious Activity Note: By clicking on the above enhancements you will be able to review a two-year comparison of Filings by County; Metropolitan Area; and Characterization of Suspicious Activity for the Suspicious Activity Report filed by Casino and Card Clubs (FinCEN Form 111).