Download

1 / 22
220 likes | 325 Views
Roadmap. Issues to consider before beginning researchAreas of concernFrequently Used Statistical Analyses Johnson's relative rankingsCompositional Analysis. Issues to consider before beginning research . Habitats under considerationhome range of the individualcomposite home range of a group of

E N D
1. Assessing habitat of radio-tagged animals
Presented by Elizabeth Doxon
23 February 2004
2. Roadmap Issues to consider before beginning research
Areas of concern
Frequently Used Statistical Analyses
Johnson�s relative rankings
Compositional Analysis
3. Issues to consider before beginning research Habitats under consideration
home range of the individual
composite home range of a group of individuals
the boundaries of your study area
Times of day under consideration
over 24 hours
day and night separately
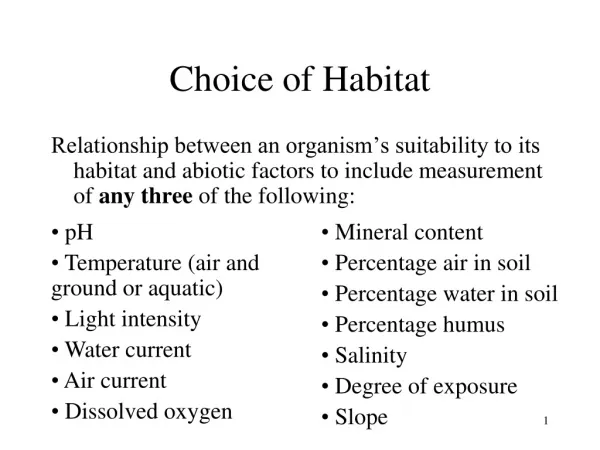
4. Areas of concern Semantics
Habitat use-the manner in which the animal uses various habitats to meet its needs (food, cover, nesting)
Habitat preference-a habitat is used more frequently than its availability would suggest
Habitat selection-behavioral response that results in the disproportionate use of habitats to influence fitness and survival
5. Areas of concern Too small sample size
Spatial precision
Different uses among categories (age, sex, or region)
Habitat availability-what habitats can actually be accessed by the animal
Pseudoreplication
Temporal autocorrelation
Unit-sum constraint-the proportional use of one habitat will affect its use of another
6. Unit-sum constraint Example
A fox squirrel has 100 locations in four equally abundant habitats.
7. Unit-sum constraint (cont.) What would happen if habitat one was water?
The ratios would not be independent (relative avoidance of one habitat creates relative preference for the other).
8. Two ways to analyze habitat Habitat used versus non-used
Less informative
Unit-sum constraint
Habitat used versus available
most commonly used
9. Statistical Analyses Frequently Used Preference Indices-Friedman (1937)
Chi-squared test
Johnson�s relative rankings
Compositional analysis
10. Preference Indices Friedman is the equivalent of analysis of variance of a randomized block design
The animal is the block, and the habitat is the treatment.
However, if the animals are territorial or form groups, this analysis will not be appropriate.
11. Chi-squared tests Chi-squared tests examine differences between observed and expected numbers of locations and whether individuals are different from each other or from random use of habitats.
The chi-squared test treats locations as independent variables (pseudoreplication) and ignores the unit-sum constraint.
12. Johnson�s relative rankings (1980) Compares ranks of habitat selection with ranks of habitat availability for each individual.
The differences between selection and availability rank for each habitat are averaged across animals to obtain a mean estimate.
The magnitude of the average differences can be used to rank the habitats from least to most preferred.
Johnson tests whether 1) overall use of habitats in non-random and 2) if the use of a particular habitat is non-random.
The public domain program, PREFWIN, is available for this analysis.
13. Johnson�s relative rankings (cont.) avoids pseudoreplication and unit-sum constraint
is relatively insensitive to the inclusion/exclusion of doubtful habitats
however, computer simulations have suggested that Johnson is prone to Type II error (lower power). This is less of a problem when sample sizes increase.
Suggested that at least 50 observations per individual on >20 animals
14. Johnson�s relative rankings (cont.)
15. Johnson�s relative rankings (cont.)
16. Compositional Analysis Use of each habitat (Ui) is expressed relative to each of the other habitats (Uj) as a log ratio In(Ui/Uj) with availability the equivalent In(Vi/Vj). Subtracting availability from use In(Ui/Uj)- In(Vi/Vj) indicates a preference between pairs of habitats.
Student�s t test can be used to determine if each habitat pair differs significantly from zero and results used to rank habitat by preference.
17. Compositional Analysis more sensitive than ranking and can be extended to analysis of covariates
avoids pseudoreplication and unit-sum constraint
possible Type I errors
18. Example
19. Example (cont.)
20. Example (cont.)
21. Example (cont.)
22. Conclusions The best way to avoid pitfalls in the data analysis is to design a good experiment.
Know the strengths and weaknesses of the various statistical analyses and compare them to what you want to examine in your research.
23. Questions?