Download
1 / 34
450 likes | 831 Views
Introduction to PET Imaging. Jack L. Lancaster, Ph.D. Statistical Parametric Mapping Course Fall 2008. RIC RESOURCES. Image Analysis Division Function (Statistical Parametric Maps) Anatomy (spatial measures) Image Normalization Databases (BrainMap/TD) Electrophysiology Division EMG, ERP

E N D
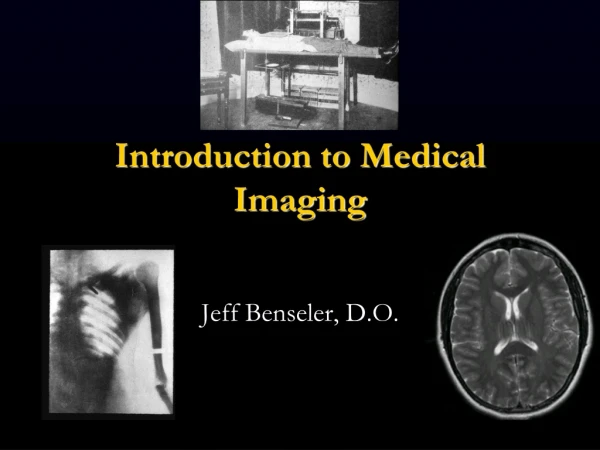
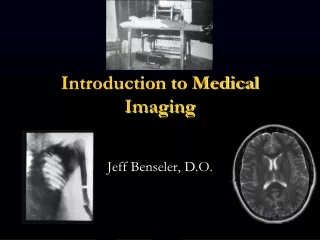
Introduction to PET Imaging Jack L. Lancaster, Ph.D. Statistical Parametric Mapping Course Fall 2008
RIC RESOURCES • Image Analysis Division • Function (Statistical Parametric Maps) • Anatomy (spatial measures) • Image Normalization • Databases (BrainMap/TD) • Electrophysiology Division • EMG, ERP • irTMS, TMS/PET • Modeling • PET Division • GE 4096 PET (~10 mm) • CTI/Siemens (~ 7 mm) • Rodent PET ( ~ 4 mm) • Primate PET (~ 3 mm) • 2x20 MeV Cyclotrons & Radiochemistry Labs • MRI Division • Siemens Trio 3T (<1 mm) • Siemens TIM Trio 3T • 2 Bruker 7T • Bruker 11.7T
Cyclotron Production of O-15 Water for CBF Studies Target Nucleus Product Nucleus 14N(d,n)15O Emitted Particle Accelerated Particle (deuteron - 1p & 1 n) Atomic Numbers: N = 7 O = 8.
O-15 Water for CBF Studies • O-15 water is an inert tracer. It is freely diffusible (approximately 95% extraction fraction in primates under normal blood flow conditions) across the blood-brain barrier; thus, the delivered tracer can diffuse quickly into the extravascular space. • Due to the small size of the water molecule, the distribution of O-15 water in the brain reflects the tissue perfusion at the capillary level. • Administered as bolus IV injection in subjects arm. • In order for images to better reflect the local cerebral blood flow distribution, a short imaging interval (~90 seconds after bolus arrives) is used to help lessen the amount of clearance of the tracer. • Multiple injections with different tasks for CBF studies.
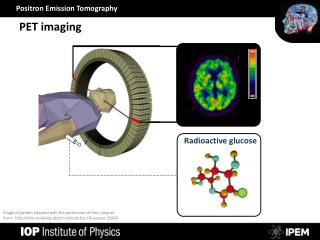
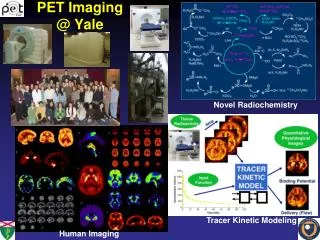
PET Brain Imaging All radionuclides are cyclotron produced
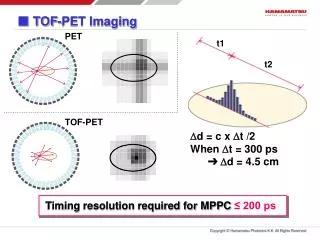
e- detector e+ positron annihilates with electron two 511 photons are emitted simultaneously in opposite directions detector unstable nucleus emits positron PETPositron Emission Tomography • What do we want to detect in PET? • 2 photons of 511 keV in coincidence, coming in a straight line from the same annihilation TRUE coincidence
Types of Coincidence • True coincidence is the simultaneous detection of the two emissions resulting from a single decay event. Increases with system sensitivity. • Scatter coincidence is when one or both photons from a single event are scattered and both are detected. Increases with body size, energy of scattered radiation is less than 511 keV. • Random coincidence is the simultaneous detection of emission from more than one decay event. Increases with radioactivity level and sensitivity of detectors. Want to form images using only true coincidence. True Scatter Random
PET CT True True • PET scanner • Typical configuration: • whole-body (patient port 60 cm; axial FOV~15 cm) • Detectors - BGO scintillation crystals with PMTs • cylindrical geometry • 32 rings of detectors • >500 detectors/ring (>18,000 total ) • several millions of Lines Of Response (LORs) • O-15 water – cerebral blood flow (CBF) • T-1/2 ~ 2 minutes • F-18 FDG - glucose metabolism • T-1/2 ~ 110 minutes
etc… PET data acquisition • Organization of data • True counts in LORs are accumulated • In some cases, groups of nearby LORs are grouped into one average LOR (“mashing”) • LORs are organized into projections
assumed measured projection projection integral of the activity along the line of response Detector efficiencyeffects Scatteredcoincidences component Attenuation Truecoincidencescomponent Random coincidencescomponent PET image reconstruction • Data corrections are necessary • the measured projections are not the same as the projections assumed during image reconstruction Object(uniformcylinder)
PET data acquisition In the 3D mode there are no septa: photons from a larger number of incident angles are accepted, increasing the sensitivity. Note that despite the name, the 2D mode provides three-dimensional reconstructed images (a collection of transaxial, sagittal and transaxial slices), just like the 3D mode! 2D mode (= with septa) 3D mode(= no septa) • 2D and 3D acquisition modes septa
PET image reconstruction Sinogram Object r
PET image reconstruction Sinogram Object r
PET image reconstruction Sinogram Object r
PET image reconstruction Sinogram Object r
PET image reconstruction Sinogram Object r
Sinogram PET: 180º (2 opposite photons) SPECT: 360º (1 photon)
etc Slice 5 etc Slice 4 Slice 3 Plane 5 Slice 2 Plane 4 Slice 1 Plane 3 Plane 2 Plane 1 2D reconstruction 2D reconstruction 2D reconstruction 2D reconstruction 2D reconstruction PET Image Reconstruction • 2D Reconstruction • Each parallel slice is reconstructed independently (a 2D sinogram originates a 2D slice) • Slices are stacked to form a 3D volumef(x,y,z) Sinograms Tomographic Images
Key Factors in Spatial Resolution Rdet - Detector resolution which relates to size, spacing of detectors in the ring. Independent of radionuclide. Rrange - Resolution component due to range of positron within tissue of interest. R180 - Resolution component due to non-colinearity of 511 KeV photons (~0.5˚).
R180~ 0.0022xD where D is distance in mm between detectors that are in coincidence Example: whole-body PET system D = 80 cm R180 ~ 2 mm. Rrangedepends on positron energy (O-15 max energy = 1720 keV, F-18 max energy = 635 keV) and tissue, but for soft tissue FWHM: O-15 0.501 mm F-18 0.102 mm
Spatial Resolution Summary Rdetimproves with smaller detectors and better imager designs. Rrangeis a function of max energy of positron and tissue type. Does not change with different systems (whole-body vs. small animal). R180~ 0.0022xD decreases with diameter of rings.
Human brain Monkey brain Animal PET~1998 PET Imaging Evolution Image credits: Crump Institute, UCLA ~4 mm FWHM ~7 mm full width half maximum of point spread function (FWHM) Image credits: CTI PET Systems (Now Siemens)
105 106 107 counts Unapodized ramp filter Hanning window, 4mm Hanning window, 8mm Noise In PET Images • Noise in PET images is dominated by the counting statistics of the coincidence events detected. • Noise can be reduced at the cost of image resolution by using an apodizing window on ramp filter in image reconstruction (FBP algorithm).
PET Cerebral Blood Flow (CBF) O-15 Water as Tracer Difference in task images D CBF Speech Production Verb Generation Petersen, Fox et al., Nature, 1988
Right supplementary motor area Left supplementary motor area Right primary motor cortex Left primary motor cortex Right hand movement Left hand movement R L
Z=56 X=52 Right primary mouth motor cortex A L-SMA Right primary mouth motor cortex B Bilateral SMA Right auditory cortex Activation pattern during paragraph reading in patients with Idiopathic PD hypophonia. A: Pre treatment and B: Post treatment.
Plastic Scintillating Fiber Rodent Arterial Monitoring System
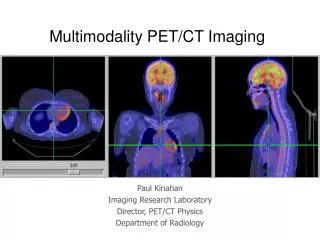
CT PET CT+PET PET/CT General Electric Medical Systems
Spatial Normalizationof Brains Spatial transforms to correct for differences in brains before group analyses Global (GSN) - 4x4 affine transform matrix Regional (RSN) – Discrete Deformation Vector Field
CC TN SC CB Fitted AC-PC Line Global Spatial Normalization of Anatomical MRI
GSN using Convex Hull Template 15O-water MRI 18F-FDG B4 After 3 different brains Talairach Convex Hull Template
Single Study Average MRI PET Axial section views following GSN of MRI and O-15 PET images of single brain image and averages from 12 subjects.
Talairach Reference System Z = +1 mm • AC-PC line (y-axis) • AC as origin • Bounding Box • 136 x 172 x 118 mm • Right-handed coordinate system Origin (AC)
BrainMap Database Web Based Searches http://www.brainmap.org:9000/bmapWeb/Experiments.jsp