Download
1 / 15
150 likes | 292 Views
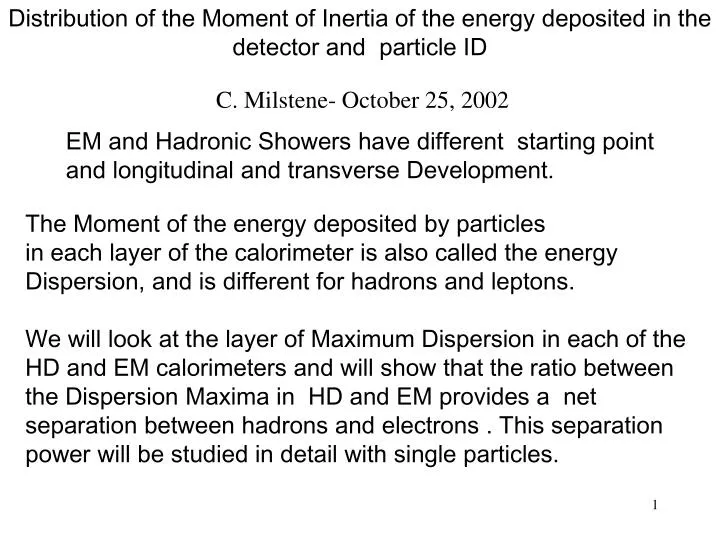
Distribution of the Moment of Inertia of the energy deposited in the detector and particle ID. C. Milstene- October 25, 2002. EM and Hadronic Showers have different starting point and longitudinal and transverse Development. The Moment of the energy deposited by particles

E N D
Distribution of the Moment of Inertia of the energy deposited in the detector and particle ID C. Milstene- October 25, 2002 EM and Hadronic Showers have different starting point and longitudinal and transverse Development. The Moment of the energy deposited by particles in each layer of the calorimeter is also called the energy Dispersion, and is different for hadrons and leptons. We will look at the layer of Maximum Dispersion in each of the HD and EM calorimeters and will show that the ratio between the Dispersion Maxima in HD and EM provides a net separation between hadrons and electrons . This separation power will be studied in detail with single particles.
The Actual Definitions: qlay= S Ecells Qbin / S Ecells- Sum on cells with E> Threshold (in Layer) flay = S Ecells fbin / S Ecells- Sum on cells with E> Threshold (in Layer) For each cell with hits in the layer: Rcell(q) = abs( qbin – qlay ) Rcell(f) = abs(fbin – flay ) The Dispersion per layer: Dispersion = S Ecells * ( (Rcell(q) )2 + (Rcell(f) )2 )
Remark: a) The second moment of the energy is proportional to the energy deposited which is varies with the particles ID, NIM-A354(1995)368-375 and is therefore a good discriminator of the particle ID (the first moment of the energy depends only on ln of the energy) b) It defines the shower LONGITUDINALY by its position TRANSVERSALY by its size c) If indeed we can identify for each event of the EM Detector, the layer with the maximum Dispersion of the Energy depositedwe got a dynamic Shower Maximum detector .
The Maximum Dispersion Distribution in HD versus EM,the transverse distribution of the shower. We look at the variable defined as the Maximum Dispersion in the EM calorimeter, in the HD calorimeter as well. In the next figures one can see that: 1)The electron either does not leave a signal in HD, or leaves a signal for which the Maximum Dispersion is smaller than in EM. 2) This is true for different electron energies. 3) We will show that the ratio of Maximum Dispersion HD/EM is smaller than 1 event by event. 3) Then we will look at the Maximum Dispersion of the signal left by hadrons both in EM (if at all) and in HD. The figure shows that the ratio of the maximum Dispersion is bigger or equal 1.
The Distribution of Maximum Dispersion for a 5GeV electron Max Dispersion in EM > Max Dispersion in HD
For a 20 GeV electron we observe the same pattern. Here too the ratio of the Maximum Dispersion HD/EM < 1
Below is the Ratio of the Maximum Dispersion event by event In HD/EM for 20GeV electron for 5000 single track Electrons.
For a 20 GeV P the maximum Dispersion are inverted between HD and EM . In magenta the Maximum Dispersion in EM which is smaller than in the HD represented inred. The HD calorimeter is located after the EM calorimeter. The 2 Distributions have been represented on top of each other to make the comparison easier.
At 5 GeV we have reported below the dispertion ratio event by event for both electrons and pions
Percentage of Misidentification e/P using the ratio of Maximum Dispersions HD/EM Smaller than one for electrons , bigger or equal one for hadrons
We will look at the distributions of the Maximum Dispersion of the hits instead of the energy left in the Cells for electrons. The relation between EM and HD is conserved
For 20 GeV electron the relation is conserved for the Maximum Hit Dispersion
This stays true for the HITS Maximum Dispersion For the 20 GeV P.
Conclusion: For single particles one can separate electrons from hadrons by their signature in EM and HD. This parameter is fast to compute and could be used on line and in the trigger. It contains the information of both the longitudinal and transverse development of showers and might be useful in a fast MonteCarlo. The distribution Energy Dispersions in the EM and HD calorimeters contains the quintessence of the shower both in energy and position. The Maximum Dispersion is located at a different depth for the hadrons and the leptons in the jet. So far we have used only the 2 points, the Maxima of the Distribution in EM and HD. A careful study of the shape of the distribution might allow to extract more information which together with the tracking information could contribute to jet analysis.