Download
1 / 8
80 likes | 93 Views
Explore how external representations like data graphics and abstract visuals can boost cognition by leveraging Information Visualization concepts. Uncover the evolution from physical data in Scientific Visualization to abstract data in Information Design. Learn about tools like Table Lens, Starfield Display, and Treemaps for interactive data exploration, rooted in decades of Academic Research. Discover how Jacques Bertin and Ben Shneiderman shaped this domain and revolutionized information processing.

E N D
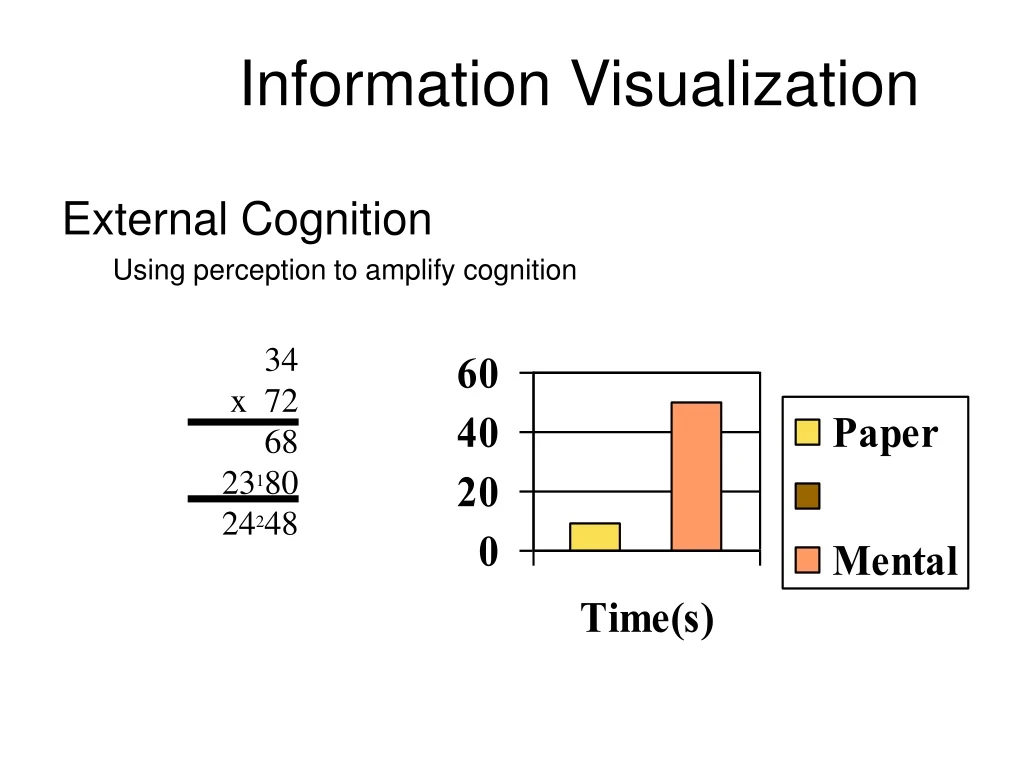
34 x 72 68 23180 24248 Information Visualization External Cognition Using perception to amplify cognition
Information Visualization Information Design/Data Graphics Using external representations to amplify cognition Using abstract external representations
Information Visualization Using interactive external representations to amplify cognition • Scientific Visualization = physical data • Information Visualization = abstract dataWWW server logs, databases… => No intrinsic visual representation
History 10 years of Academic Research Jacques Bertin (cartograph) invented the domain in the 60’s Ben Shneiderman popularized it (~90’s ) Topology ofInternet by service provider
Example : Table Lens Take a spreadsheet, replace figures with bars + add interactive manipulation of rows and columns http://www.inxight.com
Starfield Display (plots) 2D plots with interactive filtering and navigation
Treemaps For hierarchical and clustered data Micro/macro reading, size + color encode information http://www.smartmoney.com/marketmap
Treemaps (2) 800000 hits in 6 months, interactive display