Download
1 / 4
40 likes | 106 Views
Supplementary Figures showcase the upregulation of MiRNA-194 in GC tissues and the low expression of SUFU in both tissues and cell lines. qRT-PCR and immunohistochemistry were used to assess miRNA-194 and SUFU levels, demonstrating their roles in GC progression and response to treatment.

E N D
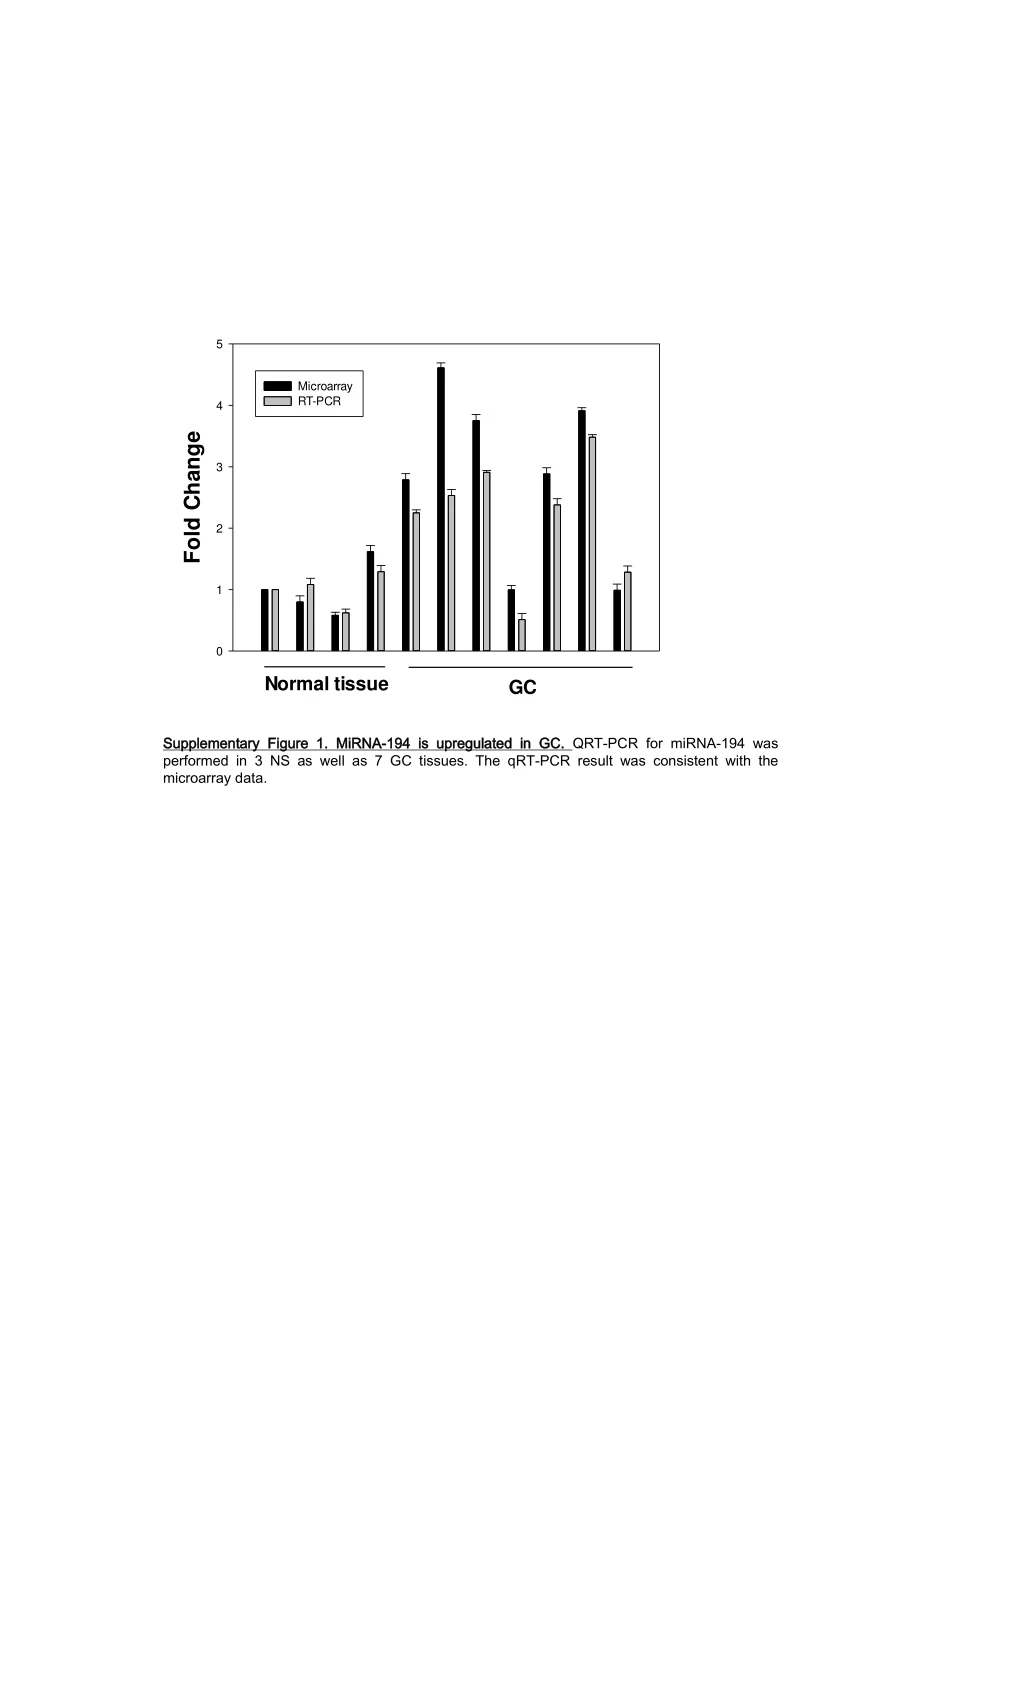
Supplementary Figure 1. MiRNA-194 is upregulated in GC. QRT-PCR for miRNA-194 was performed in 3 NS as well as 7 GC tissues. The qRT-PCR result was consistent with the microarray data.
A B SGC7901 NCI-N87 BGC823 HFE145 MKN28 Adjacent NS GC Supplementary Figure 2. SUFU protein expression level is low in GC tissues and cell lines. (A) SUFU protein expression in the tissue samples was determined by immunohistochemistry. (B) MiRNA-194 expression level in GC cell lines was measured by Western blotting. SUFU GAPDH
A B BGC823 HFE145 SUFU SUFU GAPDH GAPDH SUFU-si A SCR-si SUFU-si C SUFU-si B NSC-inh NSC-mim No treatment No treatment Supplementary Figure 3. SUFU is knocked down in HFE-145 cells and SUFU expression does not change in response to NSC-inh or NSC-mim transfection. A. HFE-145 cells were transfected with 3 different SUFU siRNAs. A mixture of all 3 siRNAs were used in all experiments. B. Neither NSC-inh nor NSC-mim changed SUFU expression levels in BGC-823 or HFE-145 cells vs. untreated cells. BGC-823 cells were transfected with NSC-inh, while HFE-145 cells were transfected with NSC-mim.