Download
1 / 48
500 likes | 611 Views
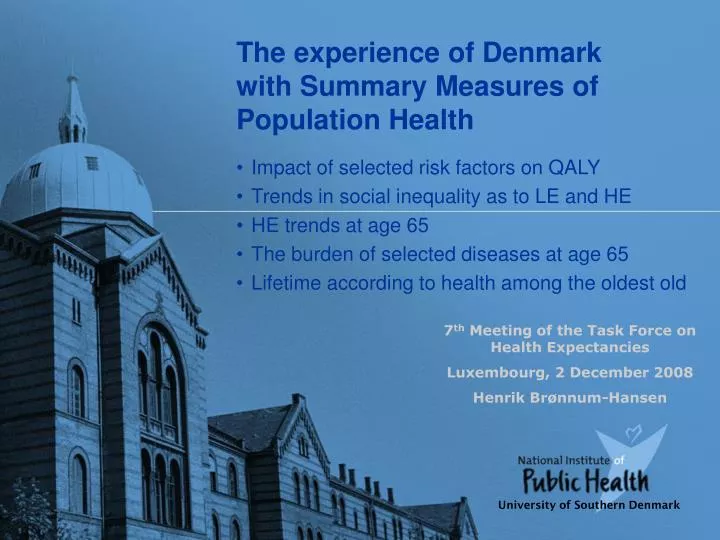
The experience of Denmark with Summary Measures of Population Health. Impact of selected risk factors on QALY Trends in social inequality as to LE and HE HE trends at age 65 The burden of selected diseases at age 65 Lifetime according to health among the oldest old.

E N D
The experience of Denmark with Summary Measures of Population Health • Impact of selected risk factors on QALY • Trends in social inequality as to LE and HE • HE trends at age 65 • The burden of selected diseases at age 65 • Lifetime according to health among the oldest old 7th Meeting of the Task Force on Health Expectancies Luxembourg, 2 December 2008 Henrik Brønnum-Hansen University of Southern Denmark
Impact of selected risk factors on quality-adjusted life-years (QALY)
Risk factors Smoking (Never smoker, Ex-smoker, Moderate smoker, Heavy smoker) Alcohol consumption (Moderate consumption versus High consumption) Physical inactivity during leisure time (Active versus Inactive) Overweight (Normal weight, Overweight, Obese) Psychosocial job strain (Active versus High strain) According to Karaseks job strain model (job demands and influence/control) Weak social relations - Meet family regularly versus Rare - Can rely on help from others Educational level (High, Intermediate, Low)
Data sources • The Cause of Death Register • As to smoking: Lung cancer death rates and relative risks from the second prospective Cancer Prevention Study (CPS-II) of the American Cancer Society • Relative risks for death estimated from the Danish National Cohort Study (DANCOS): the Danish Health Interview Surveys in 1987, 1991, 1994 and 2000 linked to the Danish Civil Registration Systemand other national registers • EQ-5D questionnaire as a supplement to and linked to the Danish Health Interview Survey 2000
2.7 5.9 2.4 3.2 0.8 3.7 2.3 5.2 6.1 5.7 5.0 3.0 2.4 Results 9.6 11.2 QALYs lost 5.4 6.1 QALYs lost 2.6 2.1 5.1 3.3 6.7 7.4
Trends in social inequality as to life expectancy and health expectancy Purpose To examine whether the social gradient in life expectancy and health expectancy has changed in Denmark
Trends in social inequality - Mortality and life expectancy- Expected lifetime in self-rated good and fair or poor health
Data sources Life tables on the basis of data from Statistics Denmark Health interview surveys (National Institute of Public Health) Surveys in 1994, 2000 and 2005
Men 700 Educational level 600 500 400 Age-standardized death rate 300 200 100 0 1980 1985 1990 1995 2000 2005 Year Age-standardized death rates for men aged 30-60. Number of deaths per 100 000 between 1981 and 2005 by educational level Low Increasing social gap Medium High
Age-standardized death rates for the age group 30-60. Number of deaths per 100 000 between 1981 and 2005 by educational level Increasing social gap Increasing social gap
Changes in the social gradient in life expectancy and expected lifetime in self-rated good and fair or poor health in Danish men Increasing social gap
Changes in the social gradient in life expectancy and expected lifetime in self-rated good and fair or poor health in Denmark Increasing social gap Increasing social gap
Numbers of interviewees aged 30 or over who participated in the Danish Health Interview Surveys 1994, 2000 and 2005 by sex and educational level
Health expectancy trends at age 65 Purpose To determine the trends in health expectancy at age 65 in Denmark during the period 1987-2005
Data sources Health interview surveys (National Institute of Public Health) Surveys in 1987, 1994, 2000 and 2005 Standard life tables (Statistics Denmark) 1986–1987, 1993–1994, 1999–2000 and 2004–2005
Self-rated health Interview question: “How do you rate your present state of health in general?” • Answer categories: • Very good or good • versus • Fair, poor or very poor
Trends in life expectancy Trends in life expectancy and expected lifetime in self-rated good and fair or poor health 65-year-old men 65-year-old women 20 20 6.9 15 15 7.8 8.6 5.0 8.2 5.3 5.1 Lifetime (years) 5.9 10 10 12.1 11.0 10.3 5 9.7 5 9.4 9.3 9.1 8.2 0 0 1987 1994 2000 2005 1987 1994 2000 2005 Expected lifetime In good health In fair or poor health
Functional limitations A person was considered to have functional limitations if he/she could do one or more of the following, only with difficulty or not at all: • walk 400 m without resting, • walk up or down a staircase from one floor to another without resting, • carry 5 kg, mobility • read ordinary newspaper print, • hear what is being said in a normal conversation between 3+ persons, • or • speak with minor or major difficulty (assessed by the interviewer) Communication
Trends in life expectancy and expected lifetime without and with functional limitations 65-year-old men 65-year-old women 20 20 7.1 15 15 7.1 4.1 8.0 7.9 3.7 4.3 5.2 Lifetime (years) 10 10 11.9 11.9 11.3 11.0 5 9.9 9.9 5 9.7 8.9 0 0 1987 1994 2000 2005 1987 1994 2000 2005 Expected lifetime without functional with functional limitations limitations Trends in life expectancy
Long-standing, limiting illness Interview question: “Do you suffer from any long-standing illness, long-standing after-effect of injury, any disability, or other long-standing condition?” If “yes” a question were asked to clarify whether the disease implied restrictions to daily life or at work
Trends in life expectancy and expected lifetime Trends in life expectancy without and with long-standing, limiting illness 65-year-old women 65-year-old men 20 20 7.9 15 15 8.6 5.5 9.4 6.1 Lifetime (years) 6.2 10 10 11.1 10.5 5 5 9.5 8.9 8.2 7.9 0 0 1994 2000 2005 1994 2000 2005 Expected lifetime without with long-standing, long-standing, limiting illness limiting illness
Conclusions Compression of morbidity is observed in Denmark when health expectancy is measured by • Self-rated health • Functional limitations • Long-standing, limiting illness
The burden of selected diseases at age 65 Purpose To quantify the health impact of diseases with high prevalence or mortality on the burden of long-standing illness among Danes aged 65 or older
Data sources Mortality, register linkage (Statistics Denmark) Sex- and age-specific numbers of persons at risk and the numbers of deaths from selected causes during the period 1995-1999 Health interview survey 2000 (National Institute of Public Health) Sex- and age-specific prevalence of long-standing, limiting illness
Long-standing, limiting illness Interview question: “Do you suffer from any long-standing illness, long-standing after-effect of injury, any disability, or other long-standing condition?” • If “yes” questions were asked to clarify: • the nature of the disease(s) (up to four diseases) • whether the disease implied restrictions to daily life or at work
Methods Construction of life tables (by sex) • Disease elimination • Construction of cause-deleted life tables • Elimination of specific diseases from prevalence of long-standing, limiting illness • Health expectancy estimates • Expected lifetime with and without long-standing, limiting illness • Observed • Hypothetical after disease elimination
1.0 0.9 Years with long- 0.8 standing illness 0.7 0.6 0.5 Survival probability 0.4 Years without 0.3 long-standing illness 0.2 0.1 0.0 0 10 20 30 40 50 60 70 80 90 100 110 Age Life expectancy and expected lifetime with and without long-standing, limiting illness before elimination of a specific disease
1.0 0.9 Years with long- 0.8 standing illness 0.7 0.6 0.5 Survival probability 0.4 Years without 0.3 long-standing illness 0.2 0.1 0.0 0 10 20 30 40 50 60 70 80 90 100 110 Age Life expectancy and expected lifetime with and without long-standing, limiting illness after elimination of a specific disease
Gain in life expectancy and changes in expected lifetime with and without long-standing, limiting illness at age 65 in Denmark, 2000, because of elimination of specific diseases
Conclusions • Cancer and diseases of the circulatory system account for 23% and 42% of deaths among Danes above the age of 65. If these fatal diseases were eliminated, the life expectancy of 65-year-olds would increase by 2.3 and 4.0 years, respectively. • The proportion of expected lifetime without long-standing, limiting illness would increase from 59.2% to 66.5% for men and from 52.2% to 55.6% for women if circulatory diseases are eliminated. • Elimination of musculoskeletal diseases would not change life expectancy but would increase the proportion of expected lifetime without long-standing, limiting illness.
Lifetime according to health among the oldest old Purpose To quantify the average lifetime according to health status among the oldest-old in Denmark
Data Survivors of the 1905 Danish birth cohort 3600 alive in 1998 2259 participants (63% of all survivors) were interviewed in 1998 and (if still alive) re-assessed in 2000, 2003 and 2005 199 (8.8%) were still alive on 1 January 2006 (age 100)
Results The average lifetime between ages 92 and 100 was about 3 years, of which • 50% in self-rated good health • 75% in a state of physical independence • 33% (at least) in a state of physical independence withoutcognitive impairment
And now... More good news?
Monday 17 November 2008 Danish elderly the most healthy in Europe = To be discussed by Ola in a minute
Thank you! University of Southern Denmark
Some extra technical notes
QALY study - Methods Construction of life tables by sex and risk factor level P0 sex and age specific prevalence of unexposed Pi prevalence for risk factor exposure level i RRi relative risk (RR0 = 1) Then sex and age specific death rate, is given by D = ∑ Pi∙RRi∙D0 and D0 death rate of unexposed can be calculated Sex and age specific death rates for unexposed, D0, are multiplied with the relative risk, RRi to estimate sex and age specific death rates for risk factor level i Finally, risk factor level specific life tables are constructed For smoking an indirect method (Peto and colleagues) was used.
EQ-5D (used to calculate QALY) Mobility I have no problems in walking about I have some problems in walking about I am confined to bed Self-care I have no problems with self-care I have some problems washing and dressing myself I am unable to wash or dressing myself Usual activities (e.g. work, study, housework, family or leisure activities) I have no problems with performing my usual activities I have some problems with performing my usual activities I am unable to perform my usual activities Pain/Discomfort I have no pain or discomfort I have moderate pain or discomfort I have extreme pain or discomfort Anxiety/Depression I am not anxious or depressed I am moderately anxious or depressed I am extremely anxious or depressed
Danish EQ-5D weights Official Danish EQ-5D weights established from a study in 2000 at University of Southern Denmark Weights for all health states defined by the EQ-5D classification system – a total of 243 (=35) states
Social inequality study Educational level Information about schooling, vocational training and further education Register information (Statistics Denmark) Questions in the health interview survey (National Institute of Public Health) • Three levels: • Low • Medium • High
Social inequality study Educational level Low - persons with a max. of 10 years of schooling and no more than semi-skilled training, basic vocational training or business school (first year) Medium - persons with either a max. of 10 years of schooling and further vocational or other training or with post-secondary schooling but no higher education High - persons with any type of higher education
Oldest old study Physically independent • If (s)he did not require assistance to • get up from a chair or a bed • walk around in the house • go to the toilet If a person was too weak to participate, a proxy was asked to assist
Oldest old study Cognitive function Measured by the Mini-Mental State Examination Scale 0-30 Score > 22: cognitively intact If a person was too weak to participate, a proxy was asked to assist
Oldest old study Physical and cognitive functioning Estimated as Physical independence without cognitive impairment
References Brønnum-Hansen H, Juel K, Davidsen M. The burden of selected diseases among older people in Denmark. Journal of Aging and Health 2006;18:491-506. Brønnum-Hansen H, Juel K, Davidsen M, Sørensen J. Impact of selected risk factors on quality-adjusted life expectancy in Denmark. Scandinavian Journal of Public Health 2007;35:510-515. Brønnum-Hansen H, Baadsgaard M. Increasing social inequality in life expectancy in Denmark. European Journal of Public Health 2007;17:585-586. Brønnum-Hansen H, Baadsgaard M. Increase in social inequality in health expectancy in Denmark. Scandinavian Journal of Public Health 2008;36:44-51. Jeune B, Brønnum-Hansen H. Trends in health expectancy at age 65 for various health indicators, 1987-2005, Denmark. European Journal of Ageing 2008;5:279-285. Brønnum-Hansen H, Petersen I, Jeune B, Christensen K. Lifetime according to health status among the oldest old in Denmark. Age and Ageing 2008; doi: 10.1093/ageing/afn239. Juel K, Sørensen J, Brønnum-Hansen H. Risk factors and public health in Danmark. Scandinavian Journal of Public Health 2008;36(Suppl 1):1-227.