Download
1 / 35
530 likes | 1.19k Views
FOURIER TRANSFORM INFRARED SPECTROSCOPY. Seda Yerli 20824388 Serap Sunatepe 20824245 Gonca Çalışkan 20823894 Beytepe ,Ankara 12.04.2012. OUTLINE History of IR Radiation and FTIR General Information about IR Spectroscopy Types of IR Spectrometers Sample Preparation

E N D
FOURIER TRANSFORM INFRARED SPECTROSCOPY Seda Yerli 20824388 Serap Sunatepe 20824245 Gonca Çalışkan 20823894 Beytepe,Ankara 12.04.2012
OUTLINE • History of IR Radiationand FTIR • General Informationabout IR Spectroscopy • Types of IR Spectrometers • SamplePreparation • Instrumentation • Applications of FTIR
Goals of presentation; • Togive general information • aboutdifferencesbetween IR spectrometers • about FTIR theory
History of IR and FTIR spectroscopy Chemical IR spectroscopy was emerged as a science in 1800 by Sir William Herschel Firstly most IR instrumentation was based on prism or grating monochromators Michelson invented interferometer in 1881
In 1949 Peter Fellgettobtainedthefirst IR spectrumbyusing FTIR spectrometer • In 1960s commercial FTIR spectrometersappeared • In 1966 Cooley-Tukeydeveloped an algorithm, which quickly does a Fourier transform
What is Spectroscopy? Spectroscopy dealswithinteractions between matter and energy Figure 1 : interaction between matter and energy
Motion of atoms and molecules IR radiation highertemperature motion more IR radiation emission
Absorption of IR Radiation Net change in molecules’ dipol moment Equıvalence in frequencies
Thespectrumtells us; The infrared spectrum for a molecule is a graphical display The spectrum has two regions: Thefingerprint region600-1200 cm-1 Functionalgroupregion1200-3600 cm-1
determining structures of compounds identifying compounds Figure 5 : infrared spectrum of isopropanol
Two types of instrumentations are used to obtain IR spectrum; Dispersive Type Fourier Transform Infrared (FTIR)
Having a filterorgratingmonochromator Dispersive Type Spectrometer Figure 6 : dispersivetypespectrometerinstrumentation
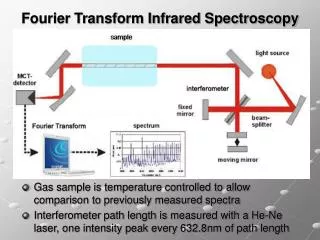
Fourier Transform Infrared Spectrometer • collecting an interferogram • simultaneously measuring • acquiringand digitizingthe interferogram • outputingthe spectrum
Why FT-IR spectroscopy? • Non-destructive technique • Good precision • No external calibration • High speed • Signal-Noise ratio • Mechanically simple
What information can FT-IR • provide? • Identify unknown material • Determine quality or consistency of sample • Determine amount of components in mixture
Sample Preparation • Gaseous samples • Long pathlength to compensate for the • diluteness • Liquid samples Can be sandwiched between two plates of a salt • sodium chloride • potassium bromide • calcium fluoride
Solids • KBr pellet • Nujol mull • Dissolving in organicsolvent(CCl4) Figure 7 : preparationKBrpellet
INSTRUMENTATION • 1.Radiation Sources • Black-body radiation • Nernst filament (ZrO and some other rare earth oxides) • Globar (Si-C) • Ni-Cr wire • Heated ceramic • Mercury lamp
2.The Interferometer • spectral encoding • resulting interferogram signal obtains Figure 8 : an interferometer
How does it work? Dividingthe radiation intotwo beams One ofthem goes to fixed mirror Other one goes to movable mirror Recombining Sending to detector Figure 9: ligthtravel in interferometer
𝛿=0 or 𝛿=𝑛𝜆 constructiveinterference 𝛿=𝜆/2 or 𝛿 = (𝑛 + 1)𝜆/2destructive interferences Figure 9 : constructive-destructiveinterfrence of waves
Interferogram: Name of the signal which has time domain and occurs as a result of constructive interferences. Figure 11 : an interferogramexample
A Fourier transform converts the time domain to the frequency domain with absorption as a function of frequency. Figure 12: example of spectrumthat is convertedbyfouriertransform
3.Detectors • The beam finally passes to the detector • Thermaldetectors • Thermocouples • Bolometer • Photoconductingdetectors • mostsensitivedetectors.
Pyroelectric detectors • much faster response time • insulator material • Triglycinesulphate Figure 13: pyroelectriccdetector
4.The Computer The measured signal is digitized and sent to the computer where the Fourier transformation takes place. Figure 14 : FTIR spectrometer
TheSampleAnalysisProcess Figure 15 : FTIR spectrometeranalysis process
Applications of FT-IR • Pharmaceutical research • Forensic investigations • Polymer analysis • Lubricant formulation and fuel additives • Foods research • Quality assurance and control • Environmental and water quality analysis methods • Biochemical and biomedical research • coatings and surfactants
References • Introduction to Spectroscopy , • Donald L. Pavia • Infrared Spectroscopy in Conservation Science, • Michele R Derrick,DusanStulik,James M. Landry • http://resources.yesicanscience.ca/trek/scisat/final/grade9/spectrometer2.html • http://roadtickle.com/10-cool-facts-about-the-human-body
http://www.health.clinuvel.com/en/uv-light-a-skin • http://mmrc.caltech.edu/FTIR/FTIRintro.pdf • Hacettepe Üniversitesi Fen Fakültesi Enstrümental Analiz Deneyleri Föyü


![Fourier transform infrared spectroscopy[FTIR]](https://cdn1.slideserve.com/2743434/fourier-transform-infrared-spectroscopy-ftir-dt.jpg)