Download
1 / 36
360 likes | 481 Views
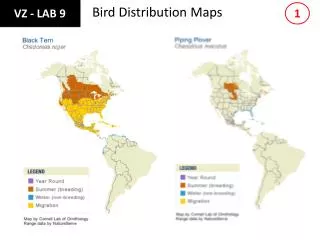
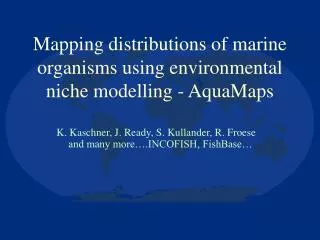
AquaMaps. AquaMaps Predictive distribution maps for marine organisms. K. Kaschner, J. S. Ready, E. Agbayani, J. Rius, K. Kesner-Reyes, P. D. Eastwood, A. B. South, S. O. Kullander, T. Rees, C. H. Close, R. Watson, D. Pauly, and R. Froese. EC project PL003739. INTRODUCTION.

E N D
AquaMaps AquaMapsPredictive distribution maps for marine organisms K. Kaschner, J. S. Ready, E. Agbayani, J. Rius, K. Kesner-Reyes, P. D. Eastwood, A. B. South, S. O. Kullander, T. Rees, C. H. Close, R. Watson, D. Pauly, and R. Froese. EC project PL003739
INTRODUCTION Niche models: Basic Concept Various algorithms exist for presence only data: GARP, Maxent, Bioclim AquaMaps designed specifically to deal with the 3D aspect of the marine environment, to incorporate expert review and to be automated, so usable with all available species data
INTRODUCTION AquaMaps Basic Concept • Environmental envelope based modeling (Habitat Suitability Index style approach) Species-specific environmental envelopes PMax (HSPEN) Relative probability of occurrence (HSPEC) Predictor (HCAF) Min Preferred min Preferred max Max
HCAF table • Environmental data per 0.5 degree latitude / longitude square • Contents • Bathymetry (min, mean, max) • Mean annual Temperature (surface and bottom) • Mean annual Salinity (surface and bottom) • Mean annual Primary productivity • Mean annual Sea ice concentration • Distance to land • Many others… • …including C-squares
ENVELOPES C-squares • Provides a unique spatial identification system for each half degree square allowing: • Easy database queries • Fast online map production • Rees, Tony. 2003. "C-Squares", a New Spatial Indexing System and its Applicability to the Description of Oceanographic Datasets. Oceanography 16 (1), pp. 11-19.
ENVELOPES Automated Envelope Generation:Selection of Species Records Minimum: n = 10 records with reliable species ID & location information European flounder (Platichthys flesus), n = 65
ENVELOPES Selection of “Good” Records Cross-check with known FAO areas of occurrence (e.g. FishBase) (N.B. Chilean e.g. dealt with by non-native status exclusion)
Store Envelope in HSPEN ENVELOPES
Store Envelope in HSPEN ENVELOPES
MODEL ALGORITHM Model Algorithm Pc = PBathymetryc*PTempc *PSalinityc*PPriProdc* PIceConcc • = Multiplicative approach: • Each parameter can act as “knock-out” criterion • Redundant parameters have no effect on distribution • Geometric mean now implemented
MODEL OUTPUT Model Output
MODEL OUTPUT Model Output
MODEL OUTPUT Model Output
MODEL OUTPUT Model Output
EXPERT REVIEW Expert review • Expert knowledge is important - the automated system provides the base from which to refine species distribution maps • Performed through the ”Create your own map” link from any species distribution map • Reviewed maps should be used in preference to un-reviewed maps in all further analysis
Key areas (parameter values are different compared to surrounding waters or other areas of known occurrence)
Recommended format for Expert Remarks • State problem with prediction (e.g., salinity min too high resulting low probability in a given area, missing distribution, etc). • Cite reference(s) if possible. • What actions were taken (e.g., changed value in salinity envelope, adjusted bounding box, added “good cells”, etc.). • Other comments affecting map prediction (e.g., bias of occurrence data, artifact of bounding box on producing linear edges to distributions).
SUMMED OUTPUTS Summary by group Current options to display by: species richness; mean length; mean trophic level; and mean resilience
SUMMED OUTPUTS Summary by personal list E.g. Where is the suitable habitat for a particular species assemblage?
SUMMED OUTPUTS Summary by personal list E.g. Where is the suitable habitat for a particular species assemblage? To right is a summary of the suitable habitat for a list of 83 species observed on an eastern pacific rocky reef (Must provide species list to AquaMaps staff at this point)
FUTURE OPTIONS Future functionality options • Area/environment delimited species checklists • Use of predictions of distributions from climate model data
FUTURE OPTIONS Future functionality options • Area/environment delimited species checklists • Use of predictions of distributions from climate model data Map showing differences in modelled sea surface temperature from 1990’s to 2040’s under a ’middle of the road’ scenario Red = heating Blue = cooling
Acknowledgements • EC funding: project PL003739 • PEW Charitable Trust • FishBase • OBIS • Sea Around Us Project • CSIRO Marine and Atmospheric Research • CEFAS, U.K. • Max Planck Institute for Meteorology