Download
1 / 41
410 likes | 449 Views
Mechanical and Electrical Events of the Cardiac Cycle. PEP 3510: Exercise Physiology PEP 4370: Exercise Management for Special Populations. Cardiac Cycle. Cardiac Cycle : the electrical, pressure and volume changes that occur in a functional heart between successive heart beats.

E N D
Mechanical and Electrical Events of the Cardiac Cycle PEP 3510: Exercise Physiology PEP 4370: Exercise Management for Special Populations
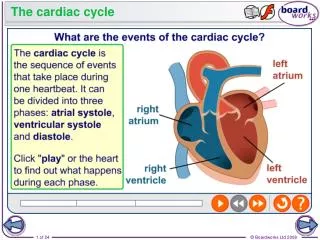
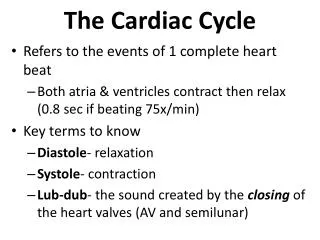
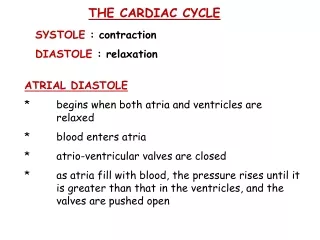
Cardiac Cycle Cardiac Cycle: the electrical, pressure and volume changes that occur in a functional heart between successive heart beats. • Phase of the cardiac cycle when myocardium is relaxed is termed diastole. • Phase of the cardiac cycle when the myocardium contracts is termed systole. • Atrial systole: when atria contract. • Ventricular systole: when ventricles contract.
Mechanical Events of the Cardiac Cycle • Ventricular Filling Period [ventricular diastole, atrial systole] • Isovolumetric Contraction Period [ventricular systole] • Ventricular Ejection Period [ventricular systole] • Isovolumetric Relaxation Period [ventricular diastole, atrial diastole]
Cardiac Cycle • Electrical changes in heart tissue cause mechanical changes, i.e. muscle contraction. • Thus, changes in electrical membrane potential of specific parts of the heart tissue represent mechanical events in specific areas of the heart tissue.
Electrocardiography • Two common abbreviations for electrocardiogram: EKG and ECG. • EKG comes from German language where cardiogram is written as kardiogram. • The ECG records the electrical activity of the heart. • Mechanical activity of the heart is sensed by echocardiography.
Electrocardiography ECG - electrocardiogram • graphic recording of electrical events • established electrode pattern results in specific tracing pattern • electrical pattern reveals blood supply problems
Electrophysiology • If an electrode is placed so that wave of depolarization spreads toward the recording electrode, the ECG records a positive (upward) deflection. • If wave of depolarization spreads away from recording electrode, a negative (downward) deflection occurs.
Electrophysiology • When myocardial muscle is completely polarized or depolarized, the ECG will not record any electrical potential but rather a flat line, isoelectric line. • After depolarization, myocardial cells undergo repolarization to return to electrical state at rest.
Electrical Events of the Cardiac Cycle • Sinoatrial (SA) node is the normal pacemaker of heart and is located in right atrium. • Depolarization spreads from SA node across atria and results in the P wave. • Three tracts within atria conduct depolarization to atrioventricular (AV) node. • Conduction slows in AV node to allow atria to empty blood into ventricles before vent. systole. • Bundle of His connects AV to bundle branches. • Purkinje fibers are terminal bundle branches.
Cardiac Cycle Coordination of : • Electrical Changes • Pressure Changes in Left Atria, Left Ventricle and Aorta • Ventricular Volume Changes • Cardiac Valves
ECG Time & Voltage • ECG machines can run at 50 or 25 mm/sec. • Major grid lines are 5 mm apart; at standard 25 mm/s, 5 mm corresponds to .20 seconds. • Minor lines are 1 mm apart; at standard 25 mm/s, 1 mm corresponds to .04 seconds. • Voltage is measured on vertical axis. • Standard calibration is 0.1 mV per mm of deflection.
Basic Electrographic Complexes • P wave represents depolarization of atria which causes atrial contraction • Repolarization of atria not normally detectable on an ECG • Excitation of bundle of His and bundle branches occur in middle of PR interval • QRS complex reflects depolarization of ventricles • T wave reflects repolarization of muscle fibers in ventricles
Electrocardiogram • Normal P wave has amplitude of ≤ 0.25 mV • Q wave is first downward deflection after P wave; signals start of ventricular depolarization • R wave is positive deflection after Q wave • S wave is negative deflection preceded by Q or R waves • T wave follows QRS
Standard 12-Lead ECG • Usually performed when person is resting in supine position. • Composed of three bipolar limb leads: I, II, and III; three augmented voltage leads: aVR, aVL, aVF; and six chest or precordial leads: V1 – V6. • All limb leads lie in frontal plane. • Chest leads circle heart in transverse plane.
Standard 12-Lead ECG • Each lead provides a different electrical angle or picture of the heart. • Anterior part of heart by looking at V1 – V4. • Lateral view of heart: I, aVL, V5 and V6. • Inferior view of heart: II, III, and aVF.
12-Lead ECG • Limb lead II shows large R amplitude because left ventricle current vector lies parallel with electrode placement. • Chest lead V1 has large S wave because left ventricle current vector is directed away from electrode.
Interpretation of ECG:Rate First measurement to calculate is heart rate. PQRST waves represent one complete cardiac cycle. • At standard paper speed, divide 1500 by distance between R to R waves. • Find R wave on heavy line. Count off 300, 150, 100, 75, 60 for each following line. Where next R lands is quick estimate. • Multiply number of cycles in 6 second marks by 10.
Interpretation of ECG:Rhythm • Normal heart rhythm has consistent R-R interval. • Mild variations due to breathing also normal.
Interpretation of ECG: Rhythm Normal Sinus Rhythm • Rate: 60-100 b/min • Rhythm: regular • P waves: upright in leads I, II, aVF • PR interval: < .20 s • QRS: < .10 s Sinus Bradycardia • Rate: < 60 bpm • Rhythm: regular Sinus Tachycardia • Rate: > 100 bpm
AV Conduction Disturbances • Atrioventricular conduction disturbances refer to blockage of electrical impulse at AV node. • 1st degree P waves result in delayed QRS. • 2nd degree some but not all P waves have QRS.
Arrhythmias Arrhythmia: an irregular heartbeat. • Sinus arrhythmia- P wave precedes @ QRS but RR interval varies. • Premature Atrial Contraction (PAC) • Premature Ventricular Contraction (PVC)
Myocardial Ischemia ST segment depression. • Hallmark of myocardial ischemia. • Reduction of oxygen-rich blood supply alters normal cellular action causing ST segment displacement ≥ 1 mm below line. • Upsloping, horizontal, downsloping
Illustration References • McArdle, Katch, Katch. 2000. Essentials of Exercise Physiology Image Collection, 2nd ed. Lippincott Williams & Wilkins • Foss and Keteyian. 1998. Physiological Basis for Exercise and Sport, 6th ed. WCB McGraw-Hill. • Robergs and Keteyian. 2003. Fundamentals of Exercise Physiology, 2nd ed. McGraw-Hill.