Download
1 / 72
1.24k likes | 2.25k Views
Ecohydrology. Fall 2013 Matt Cohen SFRC. Introductions. Name Department Title of your research (thesis, dissertation) Ordination. Applied. DK. Hydrology. Ecology. MC. Theoretical. Course Goals.

E N D
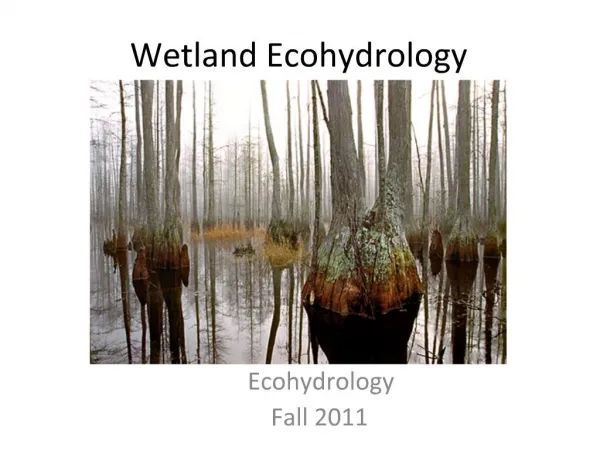
Ecohydrology Fall 2013 Matt Cohen SFRC
Introductions Name Department Title of your research (thesis, dissertation) Ordination Applied DK Hydrology Ecology MC Theoretical
Course Goals • Appreciate the dynamic and reciprocal interplay between biota and their abiotic environment (broadly construed “hydrology”) • Develop synthesis skills by focusing a large topic area into a small space [paper] • Develop hypothesis and analysis skills by asking and answering a question [project] • Develop teaching skills by guiding a group learning experience [discussion]
Defining and Defending the Term • “There are cracks in everything…that’s how the light gets in.” – Leonard Cohen • Reality is a continuum over space and (deep) time • Mantle-Soil-Water-Biota-Atmosphere-(Human) Continuum • Disciplines are “convenient” fictions • Information silos focus the questions but limit them too. This creates “cracks” that require interdisciplinarity. • Disaggregation vs. aggregation of knowledge • Ecohydrology is the essential aggregation of physical and biological theory towards understanding patterns in nature • Ecohydrology: A science which seeks to describe hydrological mechanisms that underlie ecological pattern and processes Rodriguez-Iturbe (2000)
Ecologists have studied water effects on: Animal dispersal, habitat suitability and fecundity Plant ecophysiology Soil dynamics Population ecology and community dynamics Carbon fluxes Non-native plant invasion Cropping systems Hydrologists have studied vegetation effects on: Soil erosion and geomorphology Evaporation at land surface Infiltration and runoff dynamics Atmospheric boundary layer Albedo and radiation Soil moisture – rainfall feedback Climate change Channel hydraulics Is it new?
Is it general? • Plant-soil-water relations starkly different: • Wetland hydrology (peats, fens, bogs, marshes) • Artic hydrology (boreal forests, tundra) • Tropical hydrology (rain forests, mangrove swamps) • Arid hydrology (grasses-shrublands, succulents) • Mountain hydrology • The basis principle – that hydrology and ecology and best understood as reciprocal bodies of knowledge – IS general.
Administrative Debris • Instructor: Dr. Matt Cohen • mjc@ufl.edu • http://sfrc.ufl.edu/ecohydrology/FOR6934.html • Class listserv (TBD) • 352-846-3490 • No office hours – by appt. only • TA: Bobby Hensley • Ph.D. student in SNRE working on springs and aquatic nutrient cycling • bhensley@ufl.edu • Meeting times • Tuesday (1:45-2:35 NZ222) Thursday (12:50-2:35 PSY129)
More Debris • Recommended Text: • Hydroecology and Ecohydrology: Past, Present and Future. 2007. P.J. Wood, D.M. Hannah and J.P. Sadler (eds.) • Accessing the primary literature • Weekly papers assigned on Tuesday • Discussion of papers on Thursday • Papers to be available on the course website
Additional Sources of Primary Information • Key Journals • Ecohydrology • Water Res. Research • Ecology • Ecol. Applications • Geophysical Research Letters • Hydrological Processes • Ecosystems • Hydrology and Earth System Sciences • Limnology and Oceanography • PNAS (recently) …being out there.
- - + A Rat Infestation • Gainesville home built in 1928 • No rats when we moved in • Lived there for just under 2 years • “Massive” control efforts by the end • Owners of 2 large dogs • Exceedingly poor hunters • Neighborhood of cat owners • Every direction (E, W, N, S) had one or more felines • Drove the dogs crazy…ever-vigilant border patrols
Elements of Systems • Boundary (the yard) • Inputs and outputs (cats, dead rats) • Internal components (rats, dogs) • Interactions • Positive interactions (rats breeding) • Negative interactions (cats on rats, dogs on cats)
Why Systems? • Interactions create complexity • Emergent behavior • Water is “wet” • Traffic snarls (even without accidents) • The Rise of Fall of Pet Rocks • Thresholds (tipping points) exist • Predicting these is enormously important • Global climate change, business cycles, disease epidemics • Systems aren’t more complex than we think, they are more complex than we can think. • But…we have to try! $3.95 each (!)
Key Attributes of Systems I. • Mutual causality • Components affect each other, obscuring linear cause-effect • Popularity → sales → popularity • Poverty → soil erosion → poverty • Chicken → Egg → Chicken • Indirect effects • Component A exerts control over Component B via its action on Component C A B C A B
Aleutian Islands • Nutrients are essential for plant and animal production • Phosphorus (P) is often limiting nutrient • Essential for ribosomes and metabolism • Limited geologic source in the region • Amount of P controls the productivity of the ecosystem • Grassland production of Aleutian islands is P limited • Source of P is the guano of sea birds Abundant P Depleted P
Nitrogen and Sea Birds • Seabirds eat fish from the sea but poop on land • Major flow of P from sea to land that supports productive grasslands + Fish Marine Birds + Soil P Grassland Production +
Predator Control of Ecosystems Arctic Foxes • Introduce Arctic Foxes • Top-predator • Seabirds never had a terrestrial predator • Decimated the sea-bird populations - + Fish Marine Birds + Soil P Grassland Production + Roughly 3x more soil P AND biomass on fox-free islands than on fox-infested islands
Key Attributes of Systems II. • Consist of processes at different space/time scales • Fast and slow variables • Humans and viruses • Evolution and extinction • Systems are historically contingent • Deep dependence on what happened in the past • The Great Unfolding • Beta-max, Bacteria, Base 10 A B B A C
Fast & Slow:Time Lags in Complex Systems • Variables operating at different characteristic “speeds” interact • Those interactions are complex because they can be affected by delays • Sunburns (anticipating when to reapply) • Hangovers (anticipating when to say “no”) • This affects natural systems (predator-prey systems) AND economic and social systems (business cycles, shifts in behaviors)
Consider a Simple Ecosystem • One prey item (rabbits) that reproduce quickly in proportion to their numbers • One predator (foxes) that reproduce more slowly and eat rabbits in proportion the rabbit numbers • Complex dynamics Rabbits Foxes dR/dt = (b – p*F)*R dF/dt = (r*R - d)*F
Dependence on History: Algae, Nutrients, and Shallow Lakes • Shallow lakes (< 10 m deep) • Florida has thousands • Two alternative “states” • Rooted vegetation (macrophytes) • Algae • Shifts between the two occur catastrophically, and BOTH can occur under the same environmental conditions • Where you are depends on where you’ve been
Self-Reinforcing Feedbacks in Shallow Lakes • Rooted Plant State • Plants require clear water • Plants stabilize sediments • Stable sediments keep water P concentrations low AND limit stirring • Low P limits algae and high clarity favors rooted plants • Algae State • Algae makes ooze • Ooze is easily stirred up, making the water turbid and recycling P • More P makes algae grow faster AND sediments looser via loss of plants • Regime shifts due to combined effects: • Too much P (human pollution) • Disturbances (pollution affects vulnerability)
Environmental Change and Ecosystem “State” Shifts Typical Models of Nature Emerging Model of Many Complex Systems Scheffer et al. (2001) - Nature
Example – a hydrological system Slow Sand “Trickling” Filter Depth = D[L] Area = A [L2] Saturated hydraulic conductivity (Ksat) [L T-1] *Porosity = f [-] h2 D h1= 0
Example – a hydrological system Slow Sand “Trickling” Filter Depth = D[L] Area = A [L2] Saturated hydraulic conductivity (Ksat) [L T-1] If Qin = Qouth2= ? If Qin > Qouth2= ? If Qin < Qouth2= ? constant increases decreases h2 D h1= 0 How to describe this relationship?
Influence diagram – hydrological system Qout h2 A homogenous, first-order, linear, ordinary differential equation… + - + Qin h2
Example – an ecohydrological system? Biofilm (“Schmutzdecke”) – gelatinous biofilm of bacteria fungi protozoa rotifera and a range of aquatic insect larvae. Biofilm thickness B = f (d): Slow Sand “Trickling” Filter Depth = D[L] Area = A [L2] Saturated hydraulic conductivity (Ksat) [L T-1] d h2 D h1= 0
Example – an ecohydrological system? Hydraulic conductivity affected by biofilm thickness Ksat = f (B): Slow Sand “Trickling” Filter Depth = D[L] Area = A [L2] Saturated hydraulic conductivity (Ksat) [L T-1] d h2 D h1= 0
Influence diagram – ecohydrological system h2 Qout + Ksat + Qin - - Biofilm + h2 +/-
Okavango Watershed The Okavango river shared by Angola, Namibia and Botswana Endorheic system Delta 12,000 km2 wetland system in a semi-arid environment
Water is NOT from Local Rainfall • Rain falls in Angolan highlands • Flows through semi-arid zone (losing stream) • Water is critically limiting resource • Namibia for supply and power • Angola for irrigation • Botswana for biota (incl. rich tourists)
Gumare fault Kunyere fault Thanalakane fault Gumare fault At the tail end of the East African Rift system
Flood Characteristics • Strictly seasonal rainfall over southern Africa – warm rainy summers, dry cool winters • flood-pulsed wetland, with an annual flood event • flooding asynchronous with rainy season
High End…. To Shoot an Elephant or Lion: $75,000 for license, $50,000 for lodging, food and transport To shoot pictures: $500-1000 per person per night
Material inputs to the Delta • Sediment: ~1,700,000 tons/yr • Dissolved Salts: ~500,000 tons/yr • Dust deposition: ~250,000 tons/yr?
Example 1 - Ecological processes from sediment inputs • Channel “avulsion” Surface aggradation and isostatic adjustment
Mechanism Distributary channels in the Okavango Delta Carry (and drop) sediment and distribute water Channels constrained by a dense mesh of macrophytes (papyrus) Rapid aggradation such that channels are higher than surrounding marsh Lower velocity/impoundment Increasing plant colonization further accelerates aggradation process Catastrophic bank failure and new channel initiation along pre-existing hippo trails McCarthy et al. (1992)
Large Mammal Paths Feedback Diagram for Okavango – Sediment Aggradation and Channel Self-Organization Sediment Delivery Downstream Sediment Deposition + + - + Channel Discharge Discharge Competence + - + Channel Confinement Riparian Vegetation +
Example 2 – Maintaining Low Salinity • 500,000 tons of salt delivered to Delta annually • All water lost to ET in typical years • Where’s all the salt?
Transpiration Induced Salt Translocation Mechanism Island building and density fingering Think about the nutrient budget implications as well